Sustainability KPIs: Integrating Sustainability into Business Performance Management
Last updated on : March 13, 2026
Sustainability KPIs are the scoreboard for your company’s environmental performance — they make what’s happening behind the scenes visible and actionable. Just like a sports team checks the scoreboard to see who’s ahead and where they need to improve, business leaders can use these KPIs to track energy use, waste reduction, and resource efficiency across operations. With the right metrics on the dashboard, sustainability stops being an abstract goal and becomes something measurable, comparable, and improvable — letting leaders spot gaps, make informed decisions, and celebrate tangible wins.
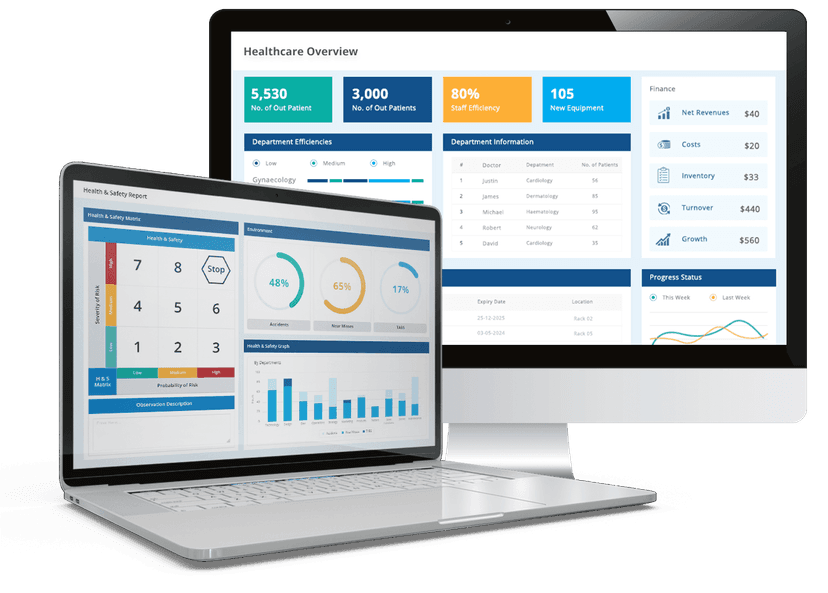
See how Sustainability KPIs are tracked in LTS Data Point
What are sustainability KPIs and why they matter
Sustainability key performance indicators (KPIs) are quantifiable metrics that help industries track progress toward sustainable operations and environmental performance. They are more than just numbers – they provide actionable insights for leaders to make informed decisions.
Key points to consider:
- Define the metrics: Sustainability KPIs calculate aspects like energy use, emissions, water consumption, waste reduction, and resource efficiency.
- Clarify performance indicators: These sustainability performance indicators show whether initiatives are achieving intended outcomes.
- Measure impact: By monitoring sustainability performance metrics, companies can compute environmental impact and operational efficiency.
- Enable operational decisions: Leaders use these KPIs to spot inefficiencies, optimise resources, and improve processes across departments.
- Support strategic goals: Sustainability KPIs connect daily operations to broader business objectives, embedding sustainability into corporate strategy.
- Improve transparency: They make previously invisible aspects of environmental performance visible, actionable, and comparable.
- Drive continuous improvement: Regular observing helps set targets, track trends, and celebrate measurable wins.
Why it matters for business leaders:
- Helps transform sustainability from a high-level goal into a manageable, measurable function.
- Bridges the gap between strategy and execution, aligning teams around concrete environmental outcomes.
- Serves as the foundation for performance scorecards and enterprise-level sustainability reporting.
How to measure and track sustainability KPIs
Sustainability KPIs only create value when they are computed consistently and tracked in a structured way. That's where a clear sustainability measurement framework and reliable data flow come in.
How organisations measure sustainability performance
- Define clear targets and baselines: Use sustainability targets and metrics to establish where the organisation is today and where it needs to go.
- Select the right indicators: Choose sustainability performance indicators that mirror real operational impact, such as energy, emissions, water, and waste.
- Build a measurement structure: A strong sustainability measurement framework links objectives, KPIs, data sources, and reporting cycles.
- Capture data from operations: Use sustainability data tracking to collect inputs from production systems, facilities, utilities, and supply chains.
How to track sustainability goals in practice
- Convert goals into trackable numbers: Translate sustainability objectives into sustainability tracking metrics that can be observed regularly.
- Use visual management: A sustainability performance dashboard shows trends, gaps and improvements immediately.
- Monitor performance over time: Ongoing environmental performance tracking spotlights whether actions are delivering results or drifting off target.
- Support decision-making: Leaders depend on these dashboards and reports to decide where to invest, improve, or intervene.
Why these matters
- Shows how to measure sustainability performance instead of depending on assumptions.
- Makes it easier to track sustainability goals across teams and sites.
- Creates a reliable data foundation for scorecards and management reviews.
Sustainability KPI examples: Metrics that drive results
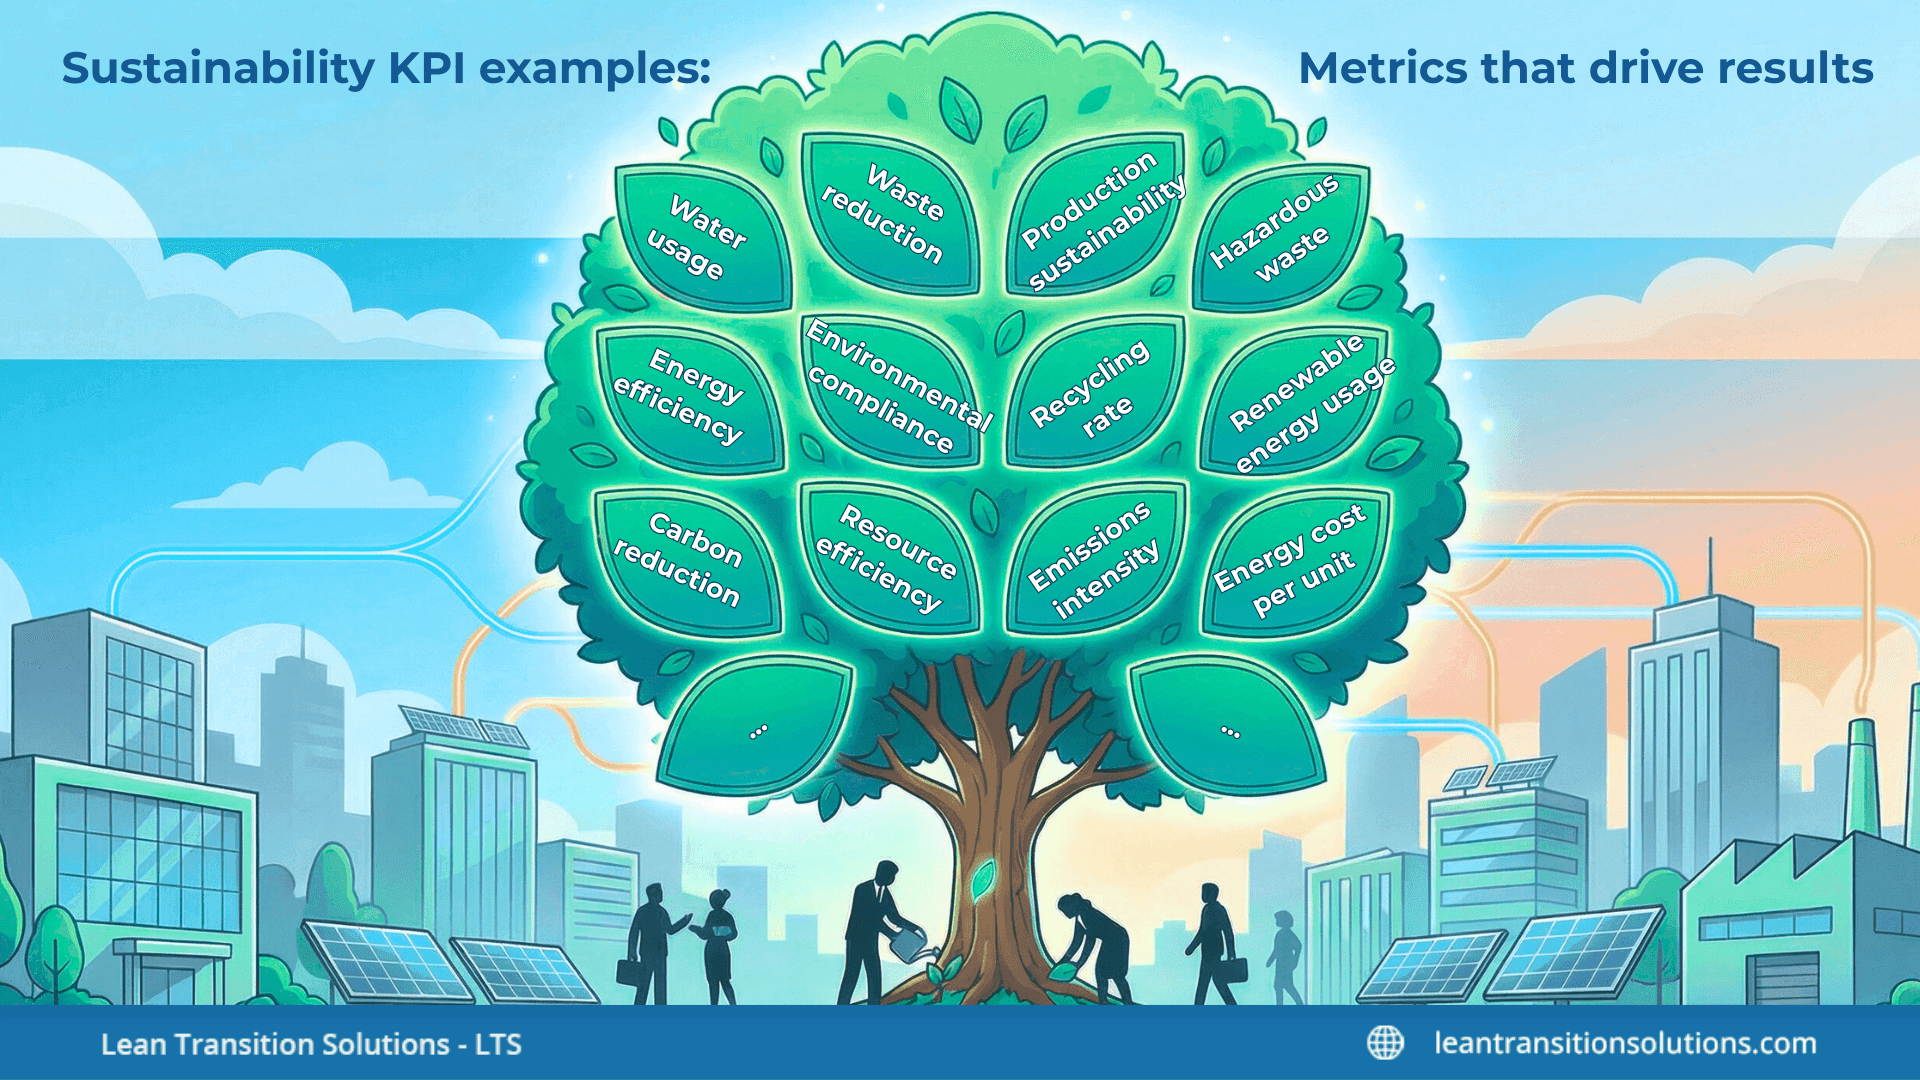
These sustainability KPIs act as sustainability performance metrics that turn environmental goals into quantifiable, operational outcomes. When organised inside a sustainability balanced scorecard, they help leaders track trends, compare sites, and drive continuous improvement across sustainable operations metrics.
Energy efficiency
Calculates how efficiently energy is used to produce output.
- Why it matters: Energy is one of the largest cost and emissions drivers. This is one of the most critical KPIs for enhancing profitability and sustainability at the same time.
- How to measure: Energy efficiency = Total energy consumed (kWh) / Units produced
Carbon reduction
Tracks how much greenhouse gas emissions are being reduced over time.
- Why it matters: This metrics show whether operational changes are actually lowering environmental impact.
- How to measure: Carbon reduction % = ((Baseline CO2 – Current CO2) / Baseline CO2) x 100
Water usage
Monitors how much water is consumed in production or operations.
- Why it matters: Water is a constrained resource. Water usage KPI help prevent waste and ensure sustainable sourcing.
- How to measure: Water usage per unit = Total water used / Units produced
Waste reduction
Tracks how much waste is being avoided, recycled, or diverted from landfill.
- Why it matters: Effective waste reduction metrics lower disposal costs and environmental damage.
- How to measure: Water usage per unit = Total water used / Units produced
Resource efficiency
Shows how efficiently raw materials are converted into finished output.
- Why it matters: It reveals losses, scrap, and inefficiencies in production.
- How to measure: Resource efficiency = Output material / Input material
Emissions intensity
Calculates emissions per unit of output.
- Why it matters: It connects sustainability directly to productivity and is one of the most practical sustainability performance metrics.
- How to measure: Emissions intensity = Total CO2 emissions / Units produced
Energy cost per unit
Monitors how energy costs affect product or service delivery.
- Why it matters: It links energy efficiency KPIs to financial performance.
- How to measure: Energy cost per unit = Total energy cost / Units produced
Recycling rate
Computes how much waste is reused instead of discarded.
- Why it matters: A core sustainable operations metric for circular economy performance.
- How to measure: Recycling rate % = (Recycled waste / Total waste) x 100
Renewable energy usage
Tracks how much energy comes from renewable sources.
- Why it matters: It supports carbon reduction and long-term sustainability.
- How to measure: Renewable energy % = (Renewable energy used / Total energy used) x 100
Hazardous waste
Tracks the volume of hazardous materials disposed.
- Why it matters: High levels indicate operational and environmental risk.
- How to measure: Hazardous waste per unit = Total hazardous waste / Units produced
Production sustainability
Computes overall sustainability impact per production unit.
- Why it matters: This is a core production sustainability impact per production unit.
- How to measure: Sustainability per unit = (Energy + Water + Emissions + Waste) / Units produced
Environmental compliance
Tracks how often operations meet environmental limits.
- Why it matters: Supports strong environmental performance tracking without drifting into ESG reporting.
- How to measure: Compliance rate % = (Compliant days / Total operating days) x 100
How these KPIs fit into a scorecard
When structured into a sustainability balanced scorecard, these sustainability KPIs feed into:
- A sustainability scorecard for strategy-level tracking
- Performance management dashboards for daily and monthly reviews
- Site, plant, and enterprise-wide comparisons
This makes sustainability part of business performance management, not a side initiative.
Localised sustainability KPIs: Why geography changes the metrics
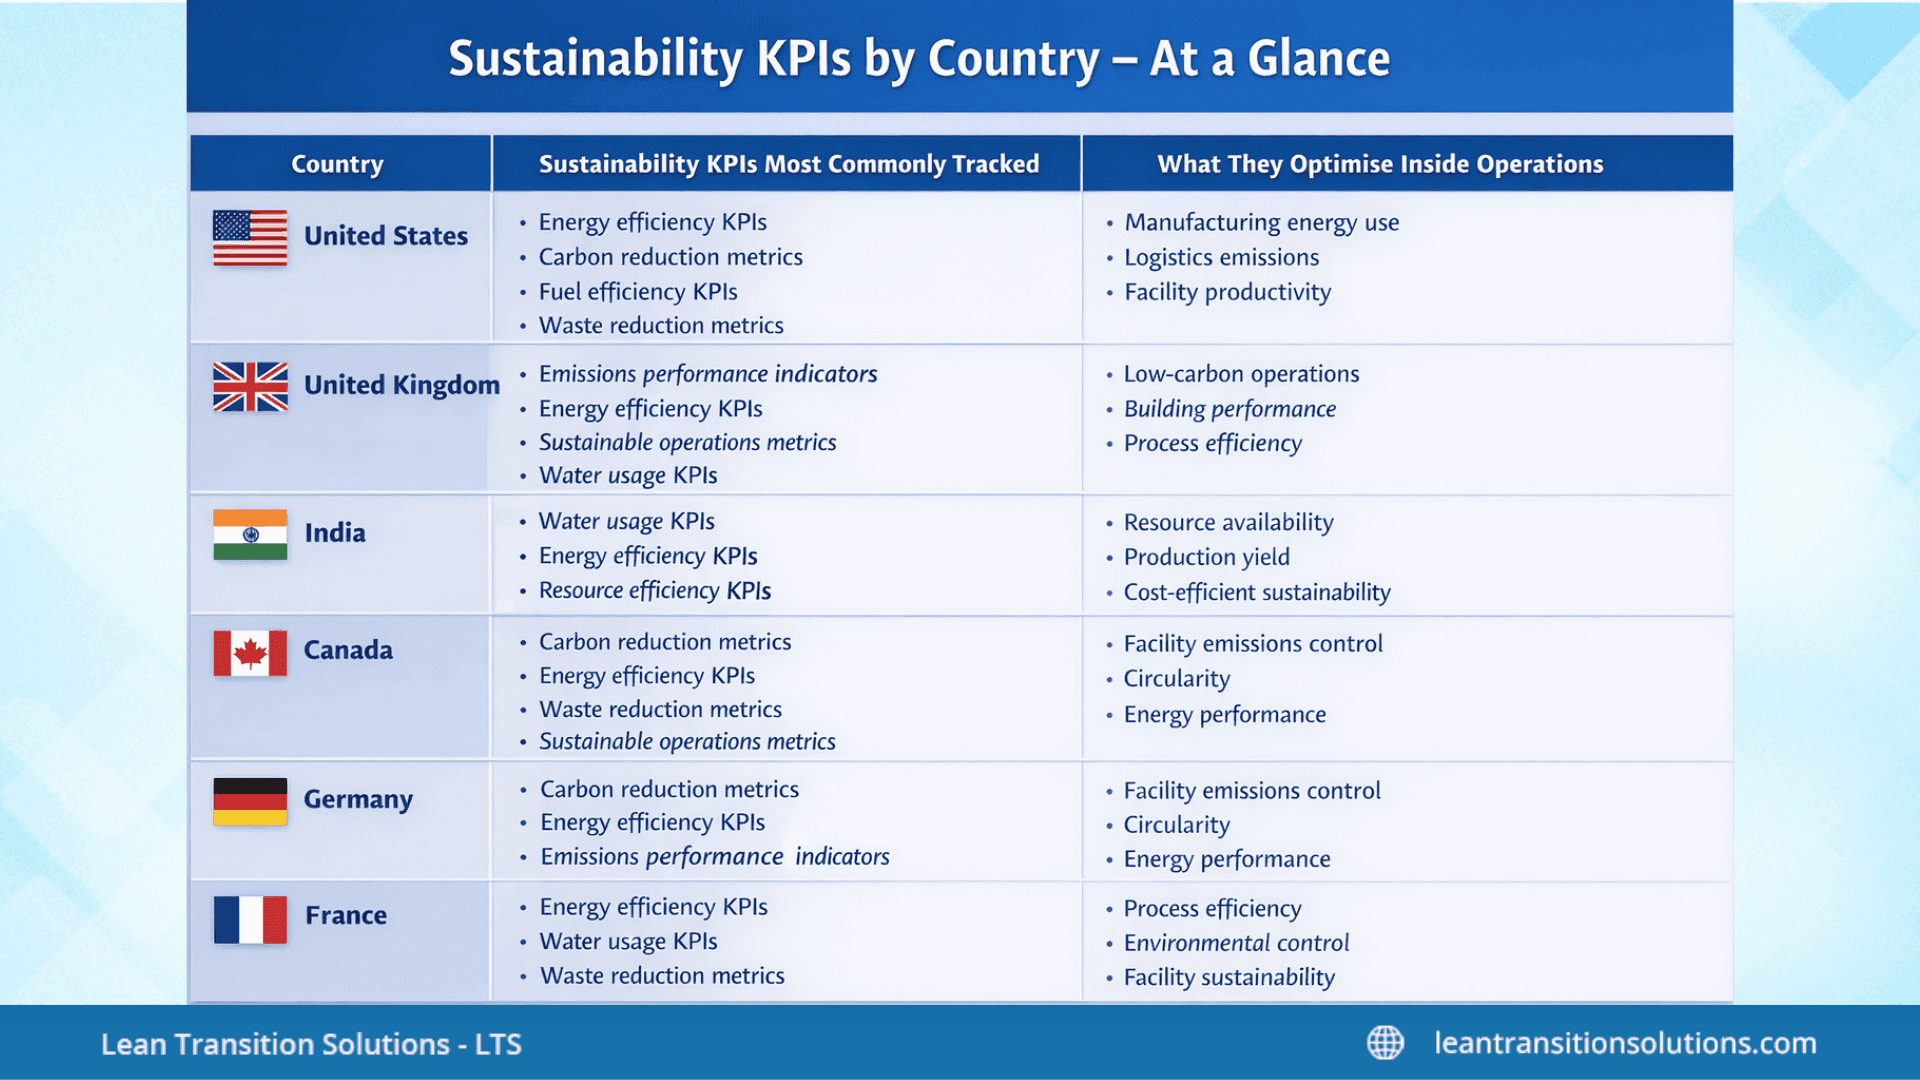
Sustainability KPIs are not one-size-fits-all. While the goal – running more efficient, lower-impact operations – is universal, what organisations measure and optimise depends heavily on local environmental, infrastructure, and resource realities. A strong sustainability performance framework adapts KPIs to reflect these regional pressures.
Below is how sustainability performance metrics typically show up across USA, UK, India, Canada, Germany, and France.
United States – Energy, emissions, and operational efficiency
In the US, sustainability KPIs are heavily shaped by energy intensity, industrial emissions, and resource productivity. With large manufacturing sites, logistics networks, and data-heavy operations, organisations focus on making energy and materials go further.
Common US sustainability KPIs include:
- Energy efficiency KPIs – Energy consumed per unit produced
- Carbon reduction metrics – CO2 per facility or per production run
- Fuel efficiency KPIs – Fuel used per mile or shipment
- Waste reduction metrics – % recycled vs disposed
These KPIs allow operations teams to optimise performance across factories, warehouses, and transportation networks.
United Kingdom – Carbon, energy and operational footprint
UK sustainability KPIs are strongly bound to carbon intensity and energy performance inside operations.
Common UK sustainability KPIs include:
- Emissions performance indicators – Tonnes of CO2 per product
- Energy efficiency KPIs – Energy per production hour
- Sustainable operations metrics – Low-carbon process adoption
- Water usage KPIs – Litres per site per day
These metrics sit inside sustainability scorecards and performance dashboards used by plant and facilities teams.
India – Water, energy and resource efficiency
In India, sustainability KPIs prioritise resource efficiency and operational resilience.
Key Indian sustainability KPIs include:
- Water usage KPIs – Litres per batch or per tonne produced
- Energy efficiency KPIs – Power consumption per shift
- Resource efficiency KPIs – Raw material yield
- Waste reduction metrics – Scrap and rework rates
These KPIs help manufacturers improve cost, reliability, and environmental performance at the same time.
Canada – Energy, emissions and waste control
Canadian sustainability KPIs focus on energy use, emissions, and circularity across industrial sites.
Common Canadian sustainability KPIs include:
- Carbon reduction metrics – Emissions per facility
- Energy efficiency KPIs – kWh per operating hour
- Waste reduction metrics – Landfill diversion rate
- Sustainable operations metrics – Clean process adoption
These metrics support enterprise performance tracking across geographically spread operations.
Germany – Resource productivity and process efficiency
German sustainability KPIs reflect its high-precision manufacturing and energy-intensive industries.
Typical sustainability KPIs include:
- Resource efficiency KPIs – Material input vs output
- Energy efficiency KPIs – Energy per unit produced
- Emissions performance indicators – CO2 per line
- Production sustainability metrics – Scrap, rework, and yield
These KPIs plug directly into performance scorecard metrics used by operations leaders.
France – Energy, water and environmental performance
French sustainability KPIs focus on process efficiency and environmental impact inside facilities.
Common French sustainability KPIs include:
- Energy efficiency KPIs – Energy per product
- Water usage KPIs – Litres per production cycle
- Waste reduction metrics – Reuse and recycling rates
- Environmental performance tracking – Emissions and discharges
These metrics allow teams to manage sustainability alongside productivity, cost, and quality.
Why localisation strengthens sustainability KPIs
Using localised sustainability KPIs allows organisations to:
- Reflect real operational conditions
- Target country-specific risks and constraints
- Run sustainability as a performance system, not a generic initiative
- Align site-level actions with enterprise sustainability goals
This is exactly how sustainability balanced scorecards and performance dashboards turn global ambition into daily operational control.
Sustainability KPIs vs ESG KPIs: Key differences
If you’d like a deeper breakdown of how these two metric systems differ and how companies use each one, explore our full guide: Sustainability KPIs vs ESG KPIs: How to Choose the Right Measurement Framework
Sustainability KPIs in business performance management
Sustainability KPIs become actionable when embedded inside a sustainability balanced scorecard, giving leaders a clear view of environmental and operational performance alongside financial and operational metrics.
How sustainability KPIs fit into performance management with LTS Data Point
- Structured KPI tracking: Sustainability KPIs act as strategic performance indicators, translating goals like energy efficiency, emissions reduction, and waste minimisation into computable metrics.
- Aligned with enterprise scorecards: Using performance scorecard metrics, sustainability KPIs are integrated alongside operational KPIs, financial KPIs, and quality KPIs for a holistic view of business performance.
- Framework support: LTS Data Point supports EQDCPS, ESQDCP, and SHEQCPLDCPS as sustainability balanced scorecard frameworks, enabling organisations to structure, prioritise, and manage sustainability KPIs effectively across all levels of the business.
- Enterprise-wide tracking: Through enterprise performance tracking and performance management dashboards, sustainability KPIs can be tracked at site, plant, or corporate level, making trends visible and actionable.
- Continuous improvement: These frameworks enable teams to spot gaps, optimise processes, and turn sustainability initiatives into quantifiable business outcomes.
Why these matters
By combining sustainability KPIs with EQDCPS, ESQDCP, or SHEQCPLDCPS frameworks in LTS Data Point, industries can:
- Measure sustainability impact consistently
- Align sustainability initiatives to corporate strategy
- Monitor progress via dashboards and scorecards
- Act quickly on deviations, improving both operational and environmental performance
Sustainability KPIs give organisations a practical way to turn sustainability from intent into performance. When structured through a sustainability balanced scorecard and managed inside LTS Data Point performance management software, these metrics become part of everyday decision-making — not just periodic reporting. Whether organisations use EQDCPS, ESQDCP, or SHEQCPLDCPS, the result is the same: sustainability is measured, reviewed, and improved with the same discipline as cost, quality, and delivery. That’s what enables leaders to move beyond sustainability targets and start managing real, measurable sustainability performance.
Get guidance on how to track Sustainability KPIs with sustainability balanced scorecards in LTS Data Point now
FAQs
1. How often should sustainability KPIs be reviewed?
Most organisations review sustainability KPIs monthly at the operational level and quarterly at the leadership level to spot trends and drive improvement.
2. Who should own sustainability KPIs inside an organisation?
Ownership typically sits with operations, facilities, and sustainability teams, with leadership reviewing results through performance scorecards.
3. Can sustainability KPIs be benchmarked across sites?
Yes. Standardised definitions allow organisations to compare plants, departments, or regions using the same sustainability KPIs.
4. What data sources feed sustainability KPIs?
They are usually fed by energy meters, production systems, utility bills, waste logs, and environmental monitoring tools.
5. Are sustainability KPIs only for large enterprises?
No. Small and mid-sized organisations can use sustainability KPIs to improve efficiency and reduce environmental impact just as effectively.
6. How do sustainability KPIs support cost reduction?
By tracking energy, water, and waste, sustainability KPIs highlight inefficiencies that translate directly into avoidable costs.
7. Can sustainability KPIs be automated?
Yes. When connected to operational systems and dashboards, sustainability KPIs can be updated automatically for real-time monitoring.
8. Do sustainability KPIs help with supplier sustainability?
They can be extended to track energy use, emissions, and waste across suppliers, improving sustainability across the value chain.