Digital SIPOC: Why Manufacturers Are Moving Off the Whiteboard
LTS Data Point's digital SIPOC mapping replaces traditional sticky notes with a live, interactive drag-and-drop process map that your entire plant can easily access, collaborate on, and keep up to date.
Contents
- What Is SIPOC, and Why Does the Whiteboard Version Keep Failing?
- Why Your SIPOC Diagram Still Needs a Gemba Walk, Not Just a Meeting Room
- The Real Cost of a Static SIPOC for UK and US Plant Managers
- How Teams Currently Manage SIPOC Today, and Where It Breaks
- What Changes When SIPOC Goes Digital
- Building a SIPOC Diagram Digitally: What the Process Actually Looks Like in LTS Data Point
- SIPOC vs VSM: Where Each One Earns Its Place
- Where LTS Data Point Fits: A Connected Home for SIPOC, Not Just Another Tool
- The Question Worth Asking Before Your Next SIPOC Workshop
Last updated on : September 30, 2026
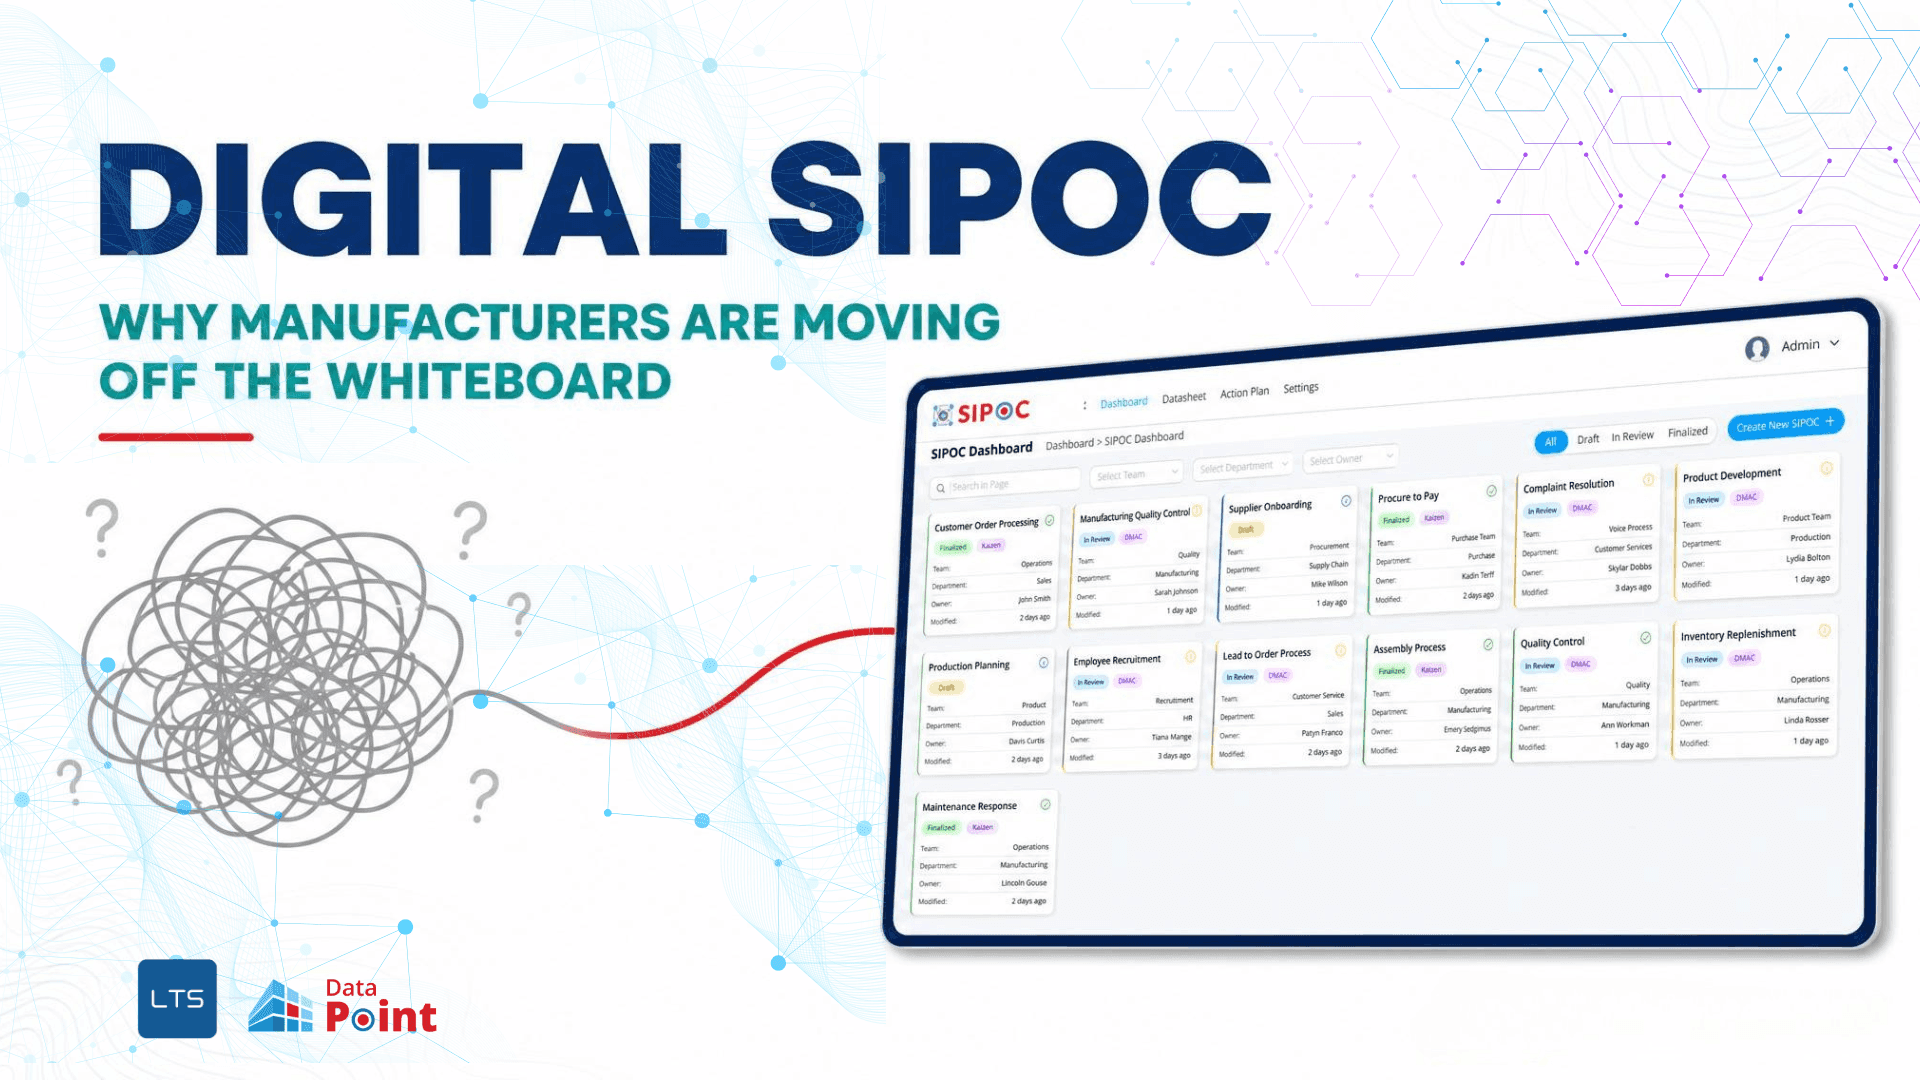
A SIPOC diagram is a high-level process map that defines a process's Suppliers, Inputs, Process, Outputs, and Customers. It sets scope and boundaries before deeper analysis begins. A digital SIPOC keeps that map live, owned, and connected to real operational data instead of frozen on a workshop wall.
LTS Data Point built exactly that: a digital SIPOC tool, live inside the same platform as SQCDP, Gemba, and Kaizen CI, rather than a diagram that quietly expires the moment the workshop ends.
What Is SIPOC, and Why Does the Whiteboard Version Keep Failing?
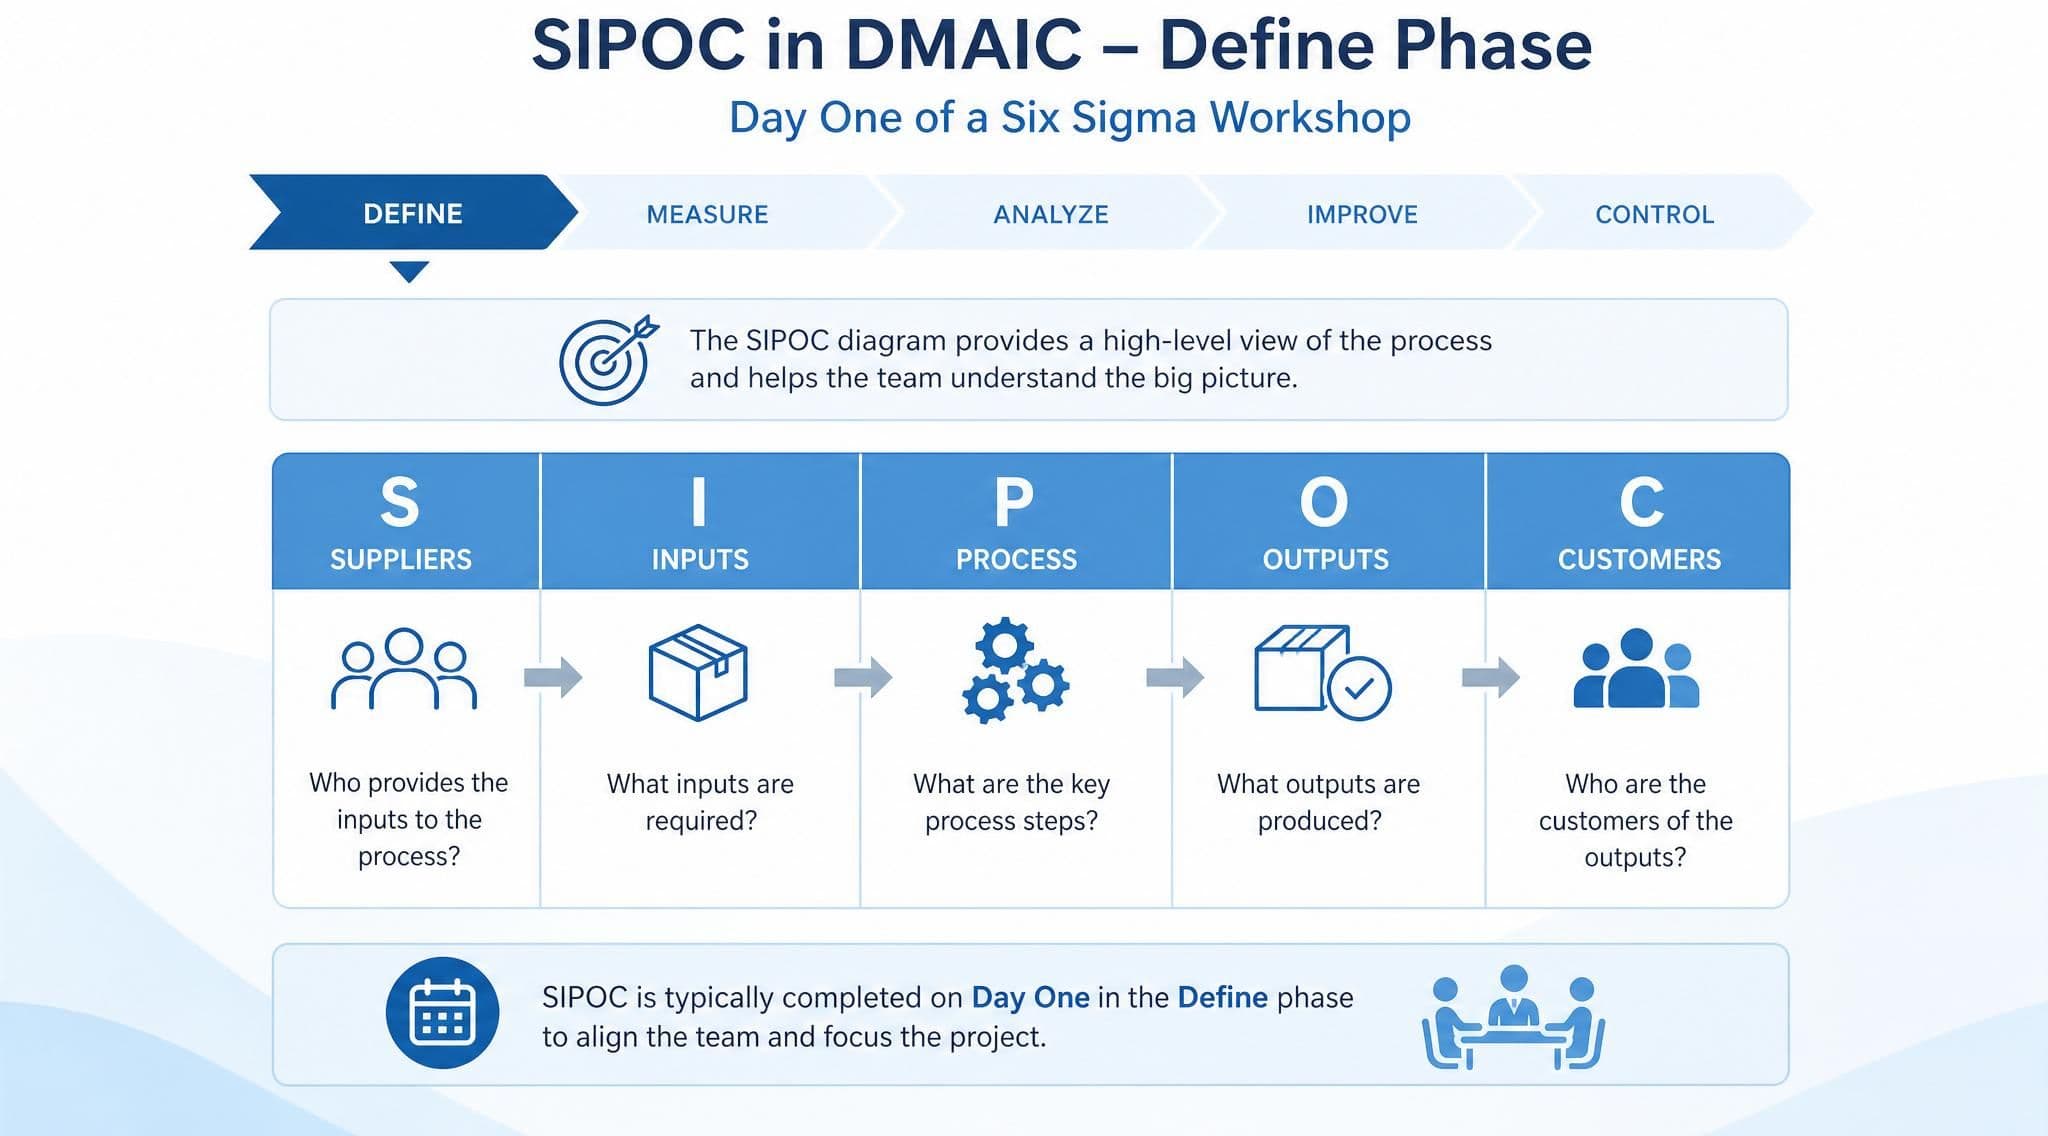
As you know, SIPOC stands for Suppliers, Inputs, Process, Outputs, Customers. It shows up in the Define phase of a DMAIC project, usually on day one of a Six Sigma workshop, usually on a whiteboard, usually with five columns and a lot of sticky notes. Before the five columns get filled in, many workshops start even looser than that with a mind map used to capture every possible supplier, input, or output before narrowing things down to what actually belongs in each column.
That part works fine. Teams leave the room aligned on scope. Everyone agrees on where the process starts and where it ends.
The trouble starts the following week. The sticky notes come down. Someone photographs the whiteboard for the records. The SIPOC diagram becomes a JPEG in a shared folder, and the process it describes keeps changing without it. This is the exact gap LTS Data Point's digital SIPOC tool was built to close, and it's worth understanding before the next workshop gets scheduled.
Explore Data Point
If your plant is already juggling separate tools for process mapping, daily management, and improvement tracking, it's worth seeing what one connected platform looks like instead of four disconnected ones.Ask any plant manager where last year's SIPOC diagrams live and watch the pause before the answer. Usually it's "somewhere on the drive." Sometimes it's a name: whoever ran that project, who has since moved teams or left the business.
That's the real failure mode. Not the framework itself, the framework is sound, but the fact that a SIPOC diagram has no owner once the workshop photo is taken. Nobody is accountable for keeping it current. Nobody gets a notification when the process it maps has quietly changed three times since.
A SIPOC diagram is meant to be a shared reference point across departments. Instead, it usually becomes a one-time deliverable, filed and forgotten, until the next audit or the next new hire asks what actually happens between goods-in and dispatch.
Why Your SIPOC Diagram Still Needs a Gemba Walk, Not Just a Meeting Room
A SIPOC built entirely from memory is only as accurate as the people in the room that day. The biggest reason SIPOC diagrams end up wrong before they're even finished: nobody checked them against what's actually happening on the floor. Lean practitioners have a name for that check: going to the Gemba, the actual place where the work happens.
What a conference-room-only SIPOC typically misses:
- A supplier substitution nobody flagged in the meeting.
- An extra inspection step that crept in after a customer complaint.
- A handoff that looks clean on paper and is chaos on the floor.
- A process step that's already been changed informally, but never updated on record.
Why this matters for accuracy, not just alignment: a SIPOC's job is to define scope correctly, and you can't define scope correctly around a process you're only picturing from memory. Walking it once, at the start, catches what recall alone won't.
You should also read: Gemba meetings with digital Gemba boards
The Real Cost of a Static SIPOC for UK and US Plant Managers
This isn't a theoretical problem. UK automotive and aerospace suppliers working to IATF 16949 or AS9100 need to show auditors a current, traceable process map, not a photo from eighteen months ago. US discrete manufacturers under OSHA and customer-driven quality systems face the same ask from a different angle: prove the documented process matches the actual one.
Pharma and life sciences sites add another layer again, where a supplier or input change can trigger a full requalification. A stale SIPOC in that environment isn't just inconvenient, it's a compliance gap waiting to be found by someone else first.
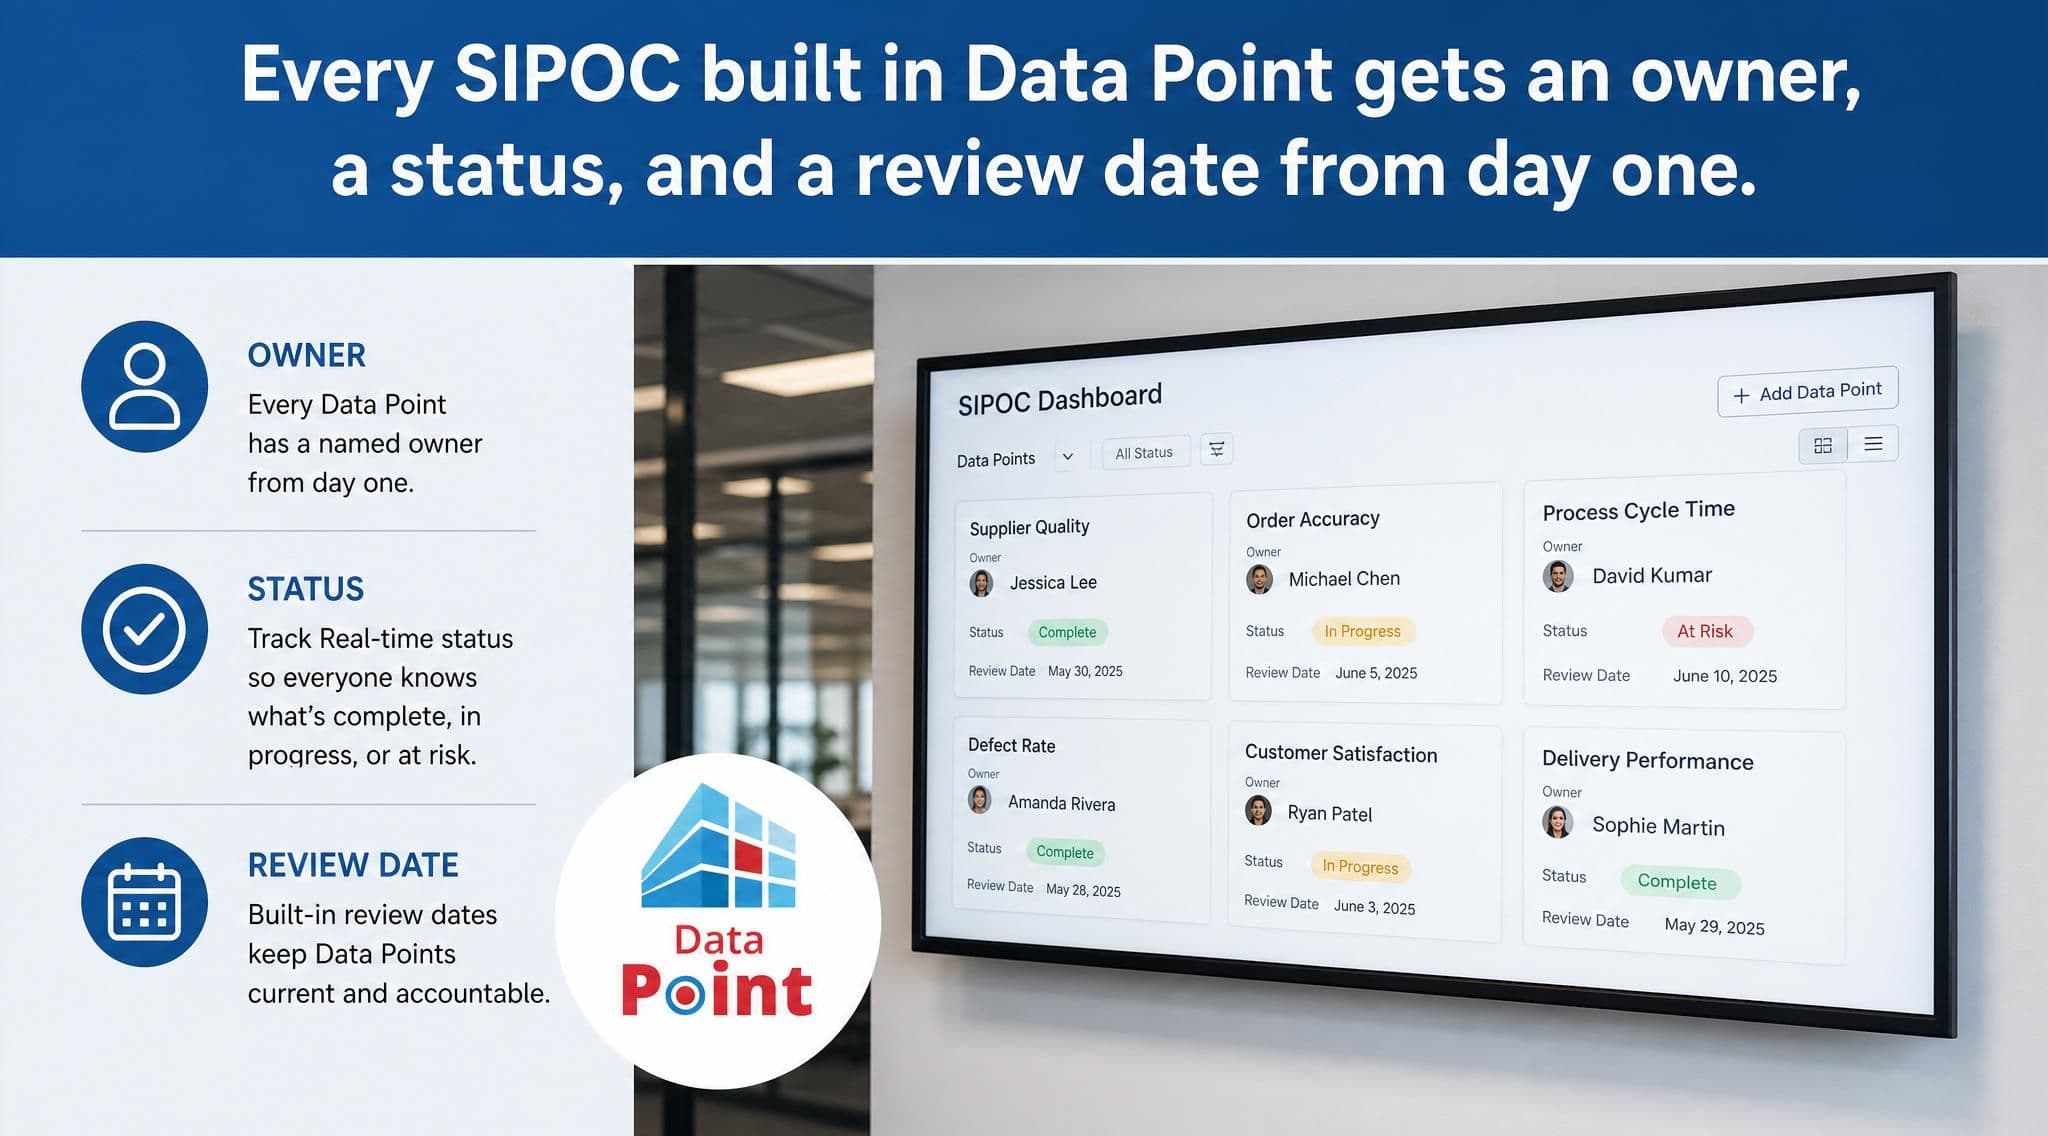
The common thread across every sector and every region: a SIPOC diagram that can't prove its current is a liability dressed up as documentation. A digital SIPOC built in LTS Data Point carries its own audit trail, owner, and last-reviewed date on the card itself, which is exactly what an auditor asks for first.
How Teams Currently Manage SIPOC Today, and Where It Breaks
Most manufacturers manage SIPOC one of three ways.
- A whiteboard photo filed in a shared drive.
- A Visio or PowerPoint file that somebody has to remember to update.
- A spreadsheet template, which at least has structure but still lives outside any system that tracks the actual operation.
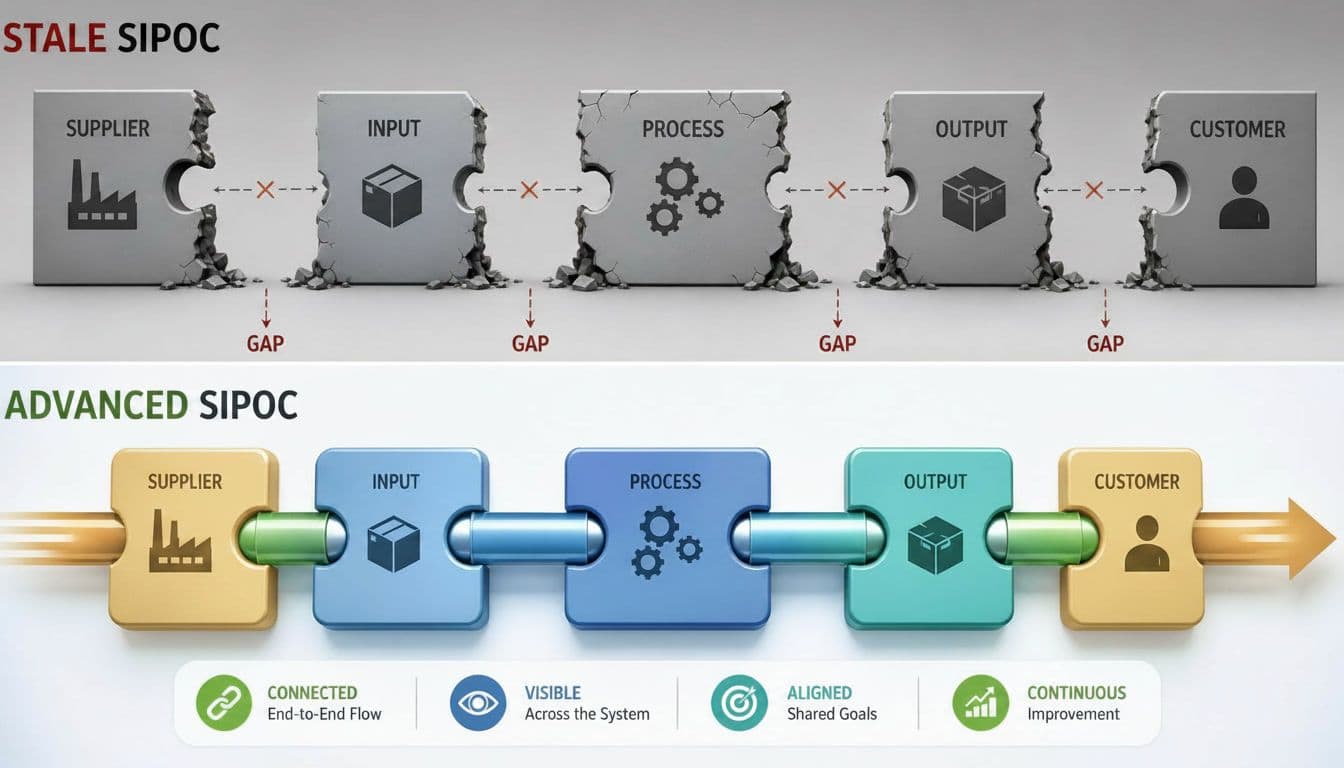
All three share the same weakness. The challenges traditional SIPOC diagrams are given below.
- None of them are connected to the process they describe.
- None of them notify anyone when the process drifts.
- None of them show you, at a glance, which SIPOC diagrams across the plant are current, which are overdue for review, and which nobody's touched since the auditor left.
What Changes When SIPOC Goes Digital
A digital SIPOC isn't a fancier drawing tool. It's the same five-column logic, Suppliers, Inputs, Process, Outputs, Customers, rebuilt as a living record inside a platform like LTS Data Point rather than a static file outside one. Building a SIPOC Diagram Digitally: What the Process Actually Looks Like in LTS Data Point
Building a SIPOC Diagram Digitally: What the Process Actually Looks Like in LTS Data Point
Building a digital SIPOC looks close to the workshop version at first, then keeps going. Here's the actual sequence:
Define the five categories.
Suppliers, inputs, process steps, outputs, and customers, same starting point as any SIPOC diagram.
Walk the floor to confirm it.
Verify each step against the real process instead of guessing from a meeting room.
Build it directly in Data Point, not a slide.
Drag and drop to reorder steps as the process takes shape.
Assign an owner and a review date.
This is what stops the SIPOC from going stale the moment the file gets saved.
Tag the department and methodology.
So, anyone searching later knows exactly whose process this is and how it's run.
It lands on the SIPOC Dashboard.
Filterable by status, owner, or team, searchable the moment someone needs it instead of the moment someone remembers where it's saved.
You should also read: Process improvement techniques for operational success; Analysing with precision: root cause analysis techniques
SIPOC vs VSM: Where Each One Earns Its Place
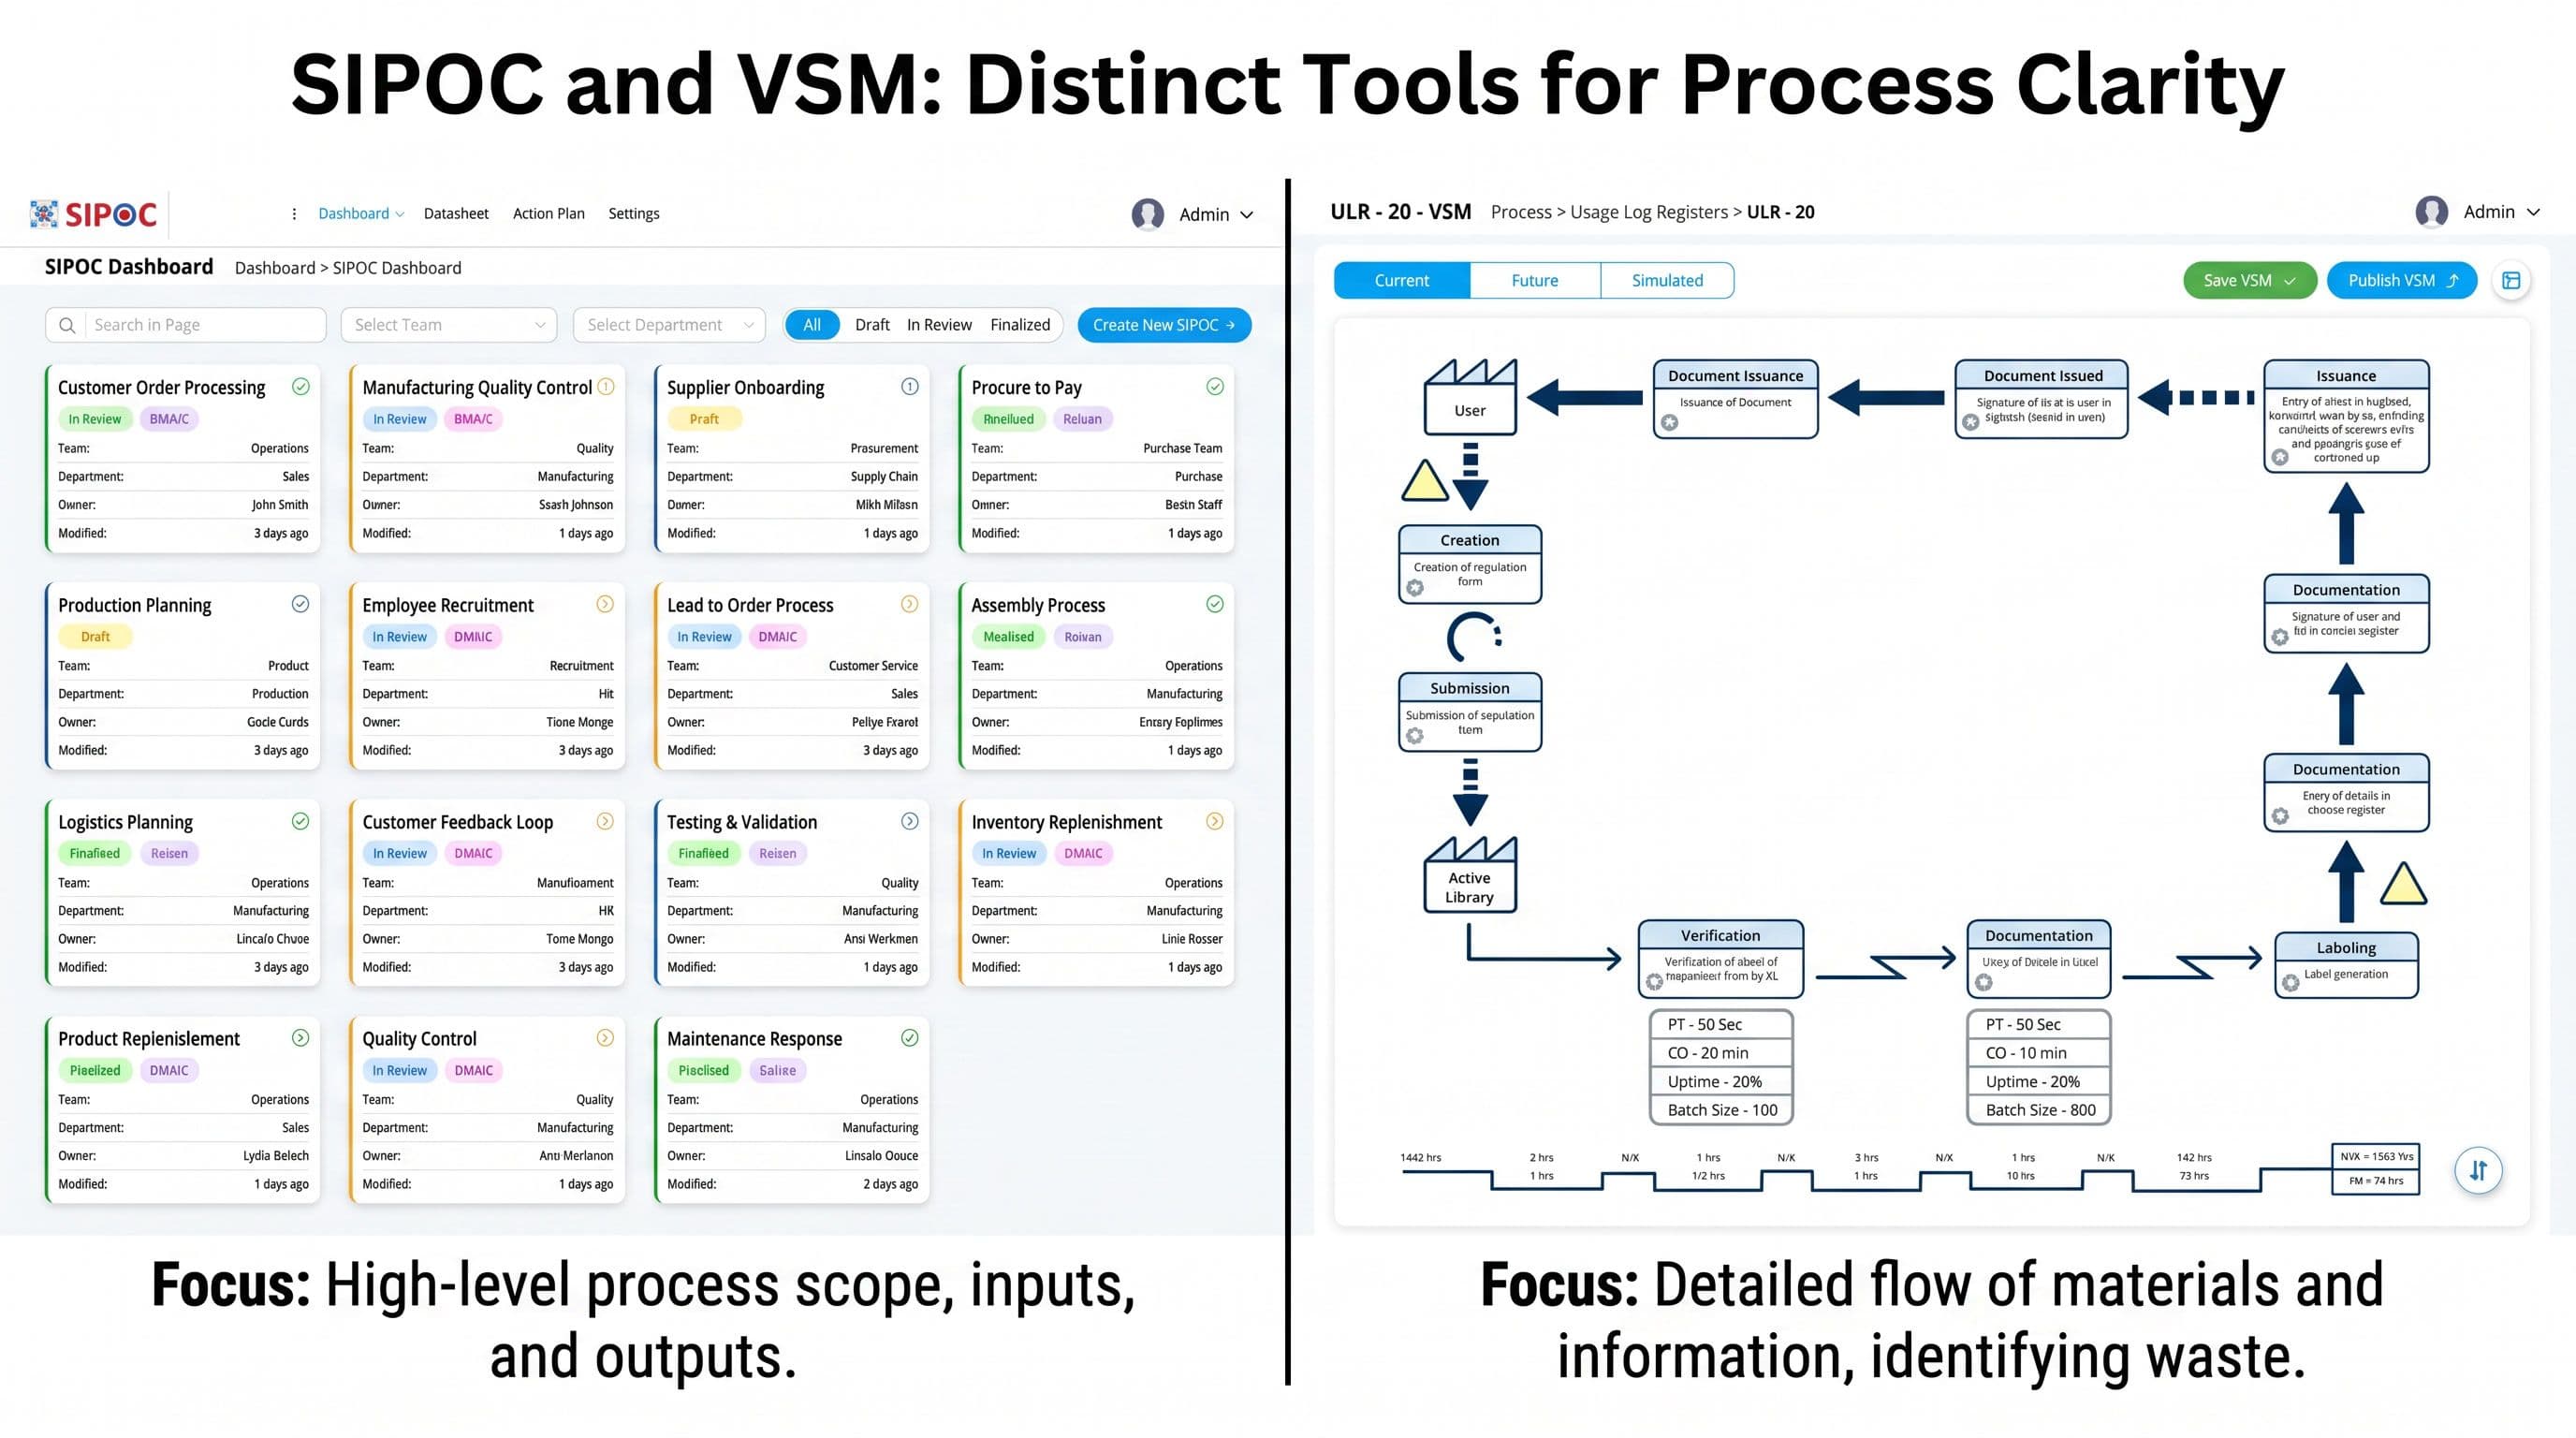
SIPOC and Value Stream Mapping get confused constantly, largely because they're often taught back-to-back in the same Six Sigma course.
Neither replaces the other. A SIPOC diagram tells you where a process begins and ends. A VSM tells you what's actually happening, and where the waste is hiding, inside those boundaries. Used together, and kept current together, they give a plant both the map and the terrain. LTS Data Point houses in the same Operational Performance cluster, so a team moving from SIPOC scoping into a full value stream map isn't switching tools, just switching views.
You should also read: How do you use a SQCDP board; Create an effective report using the SQCDP framework
Where LTS Data Point Fits: A Connected Home for SIPOC, Not Just Another Tool
Most manufacturers don't actually need another diagramming app. They need the SIPOC they already build to stop disappearing after the workshop.
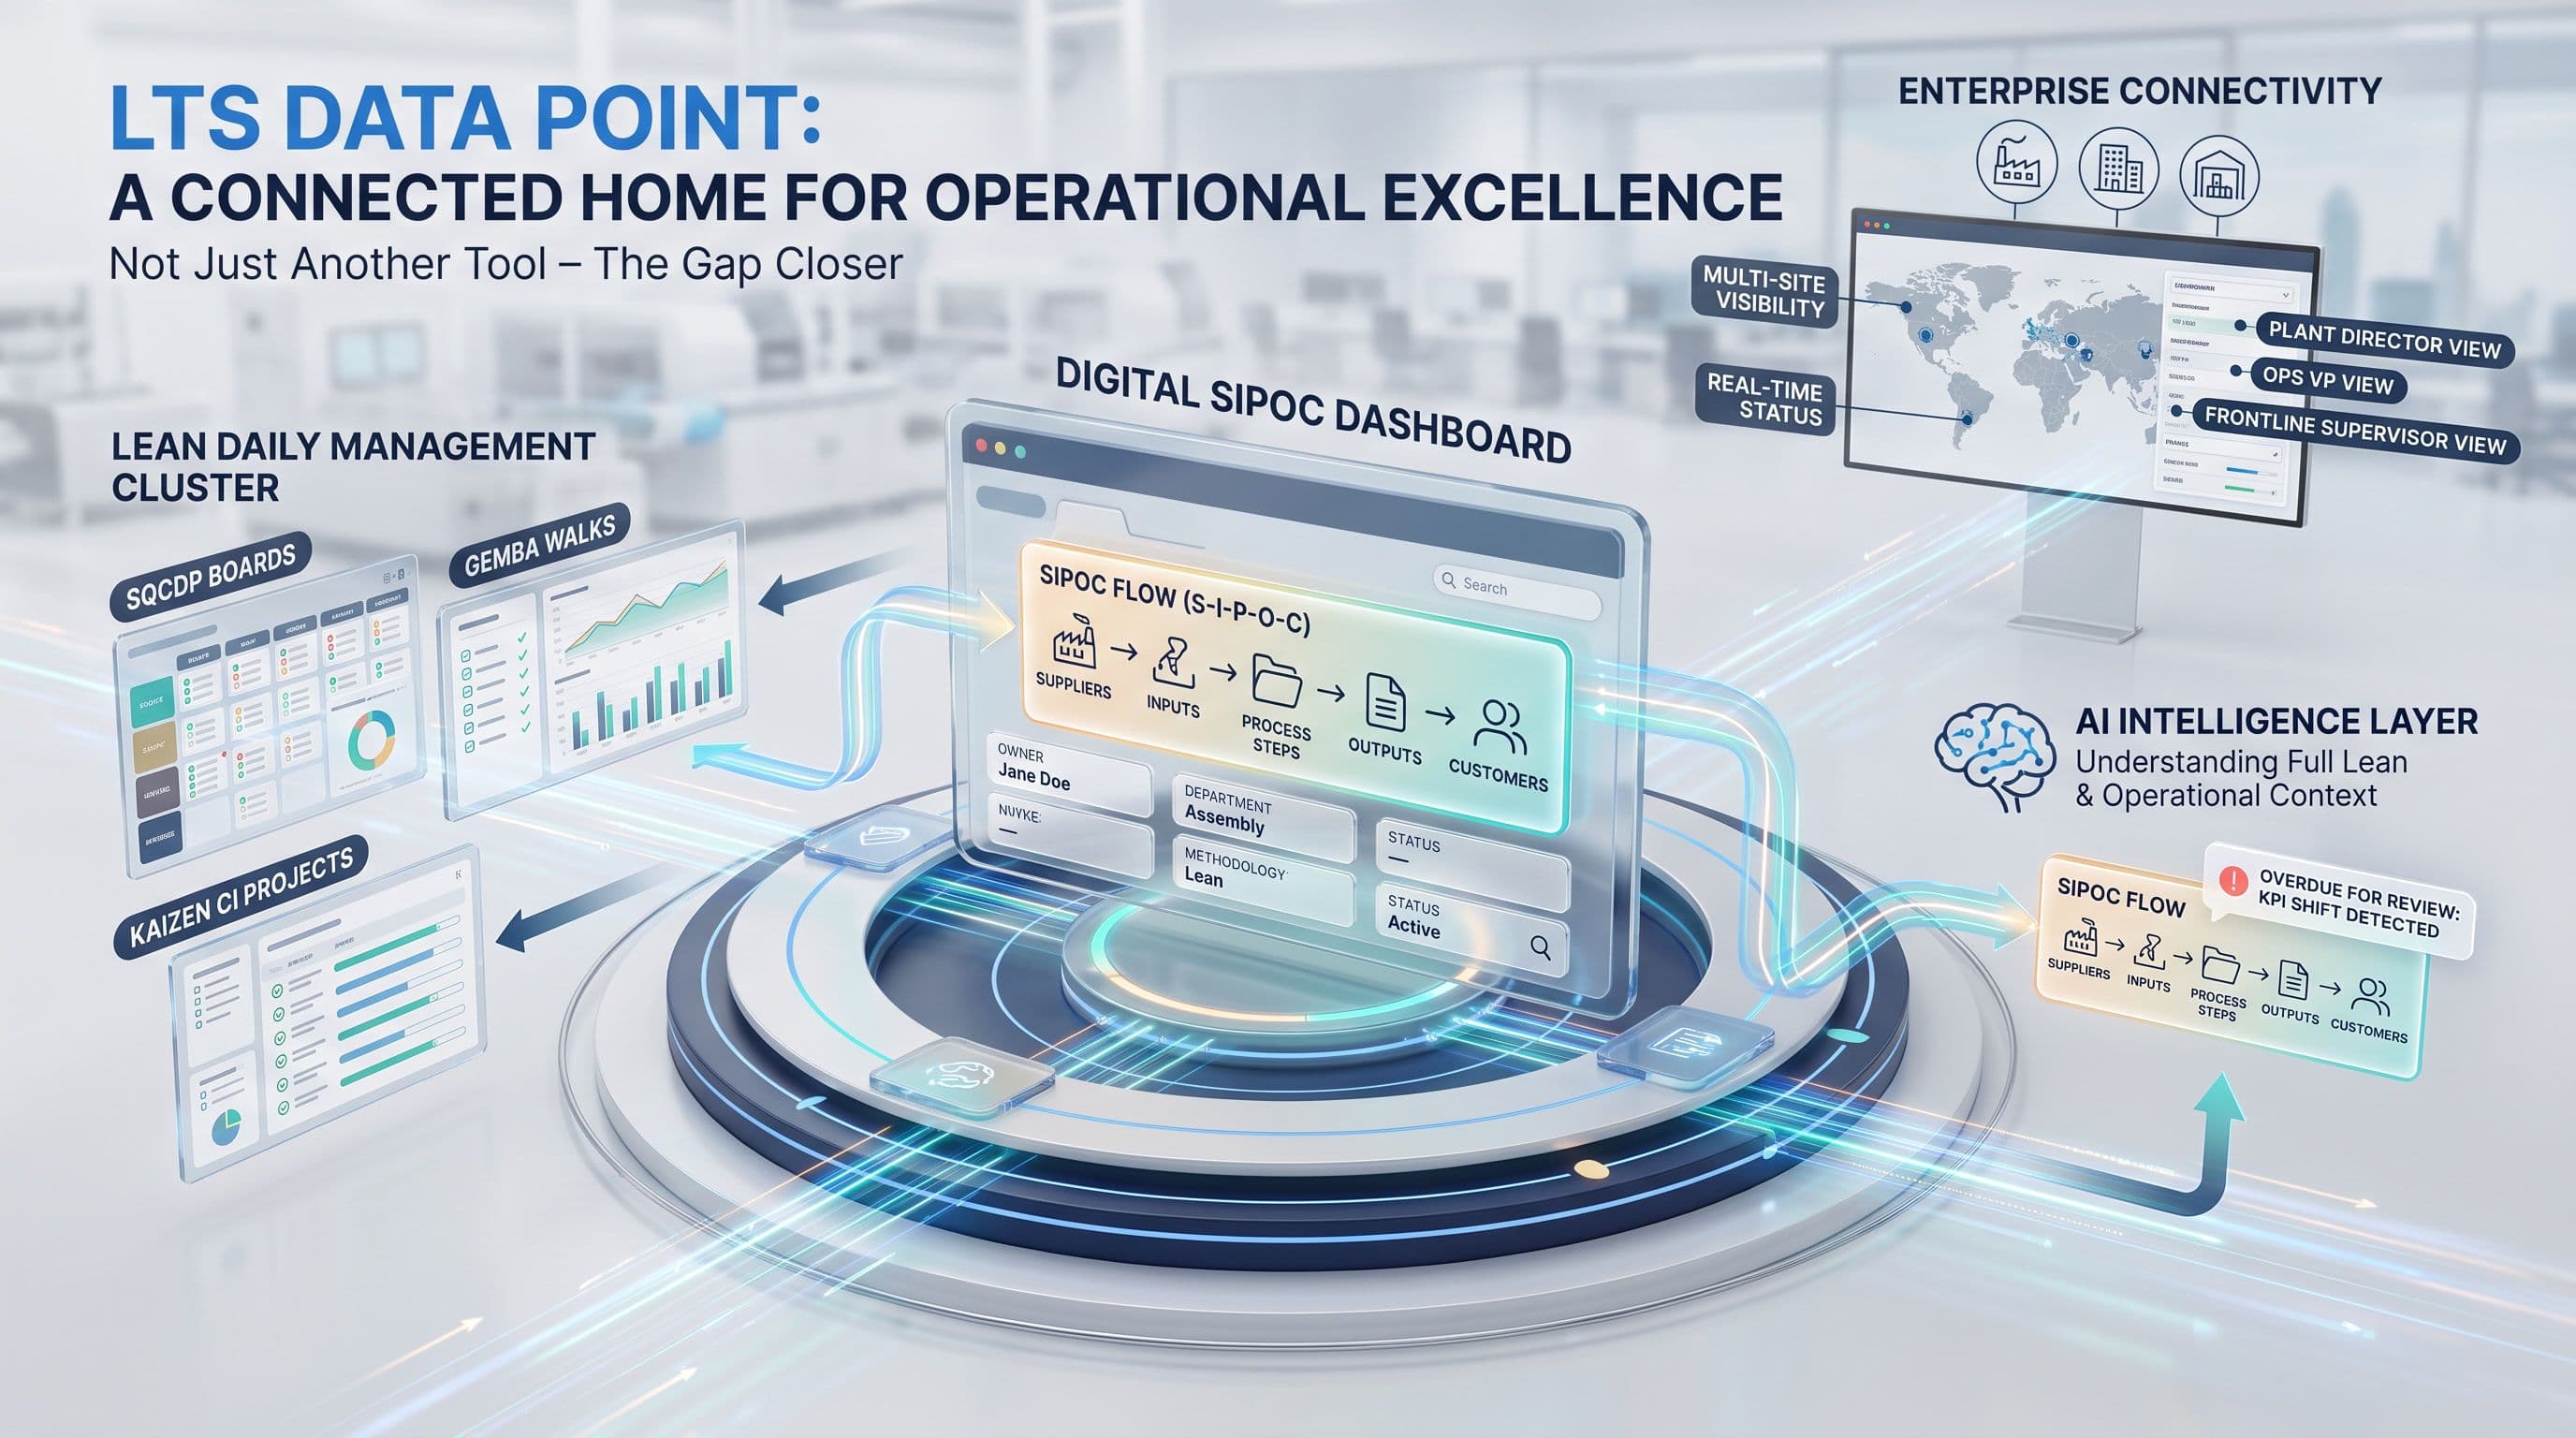
That's the gap LTS Data Point was built to close. Inside Data Point's Lean Daily Management cluster, a digital SIPOC sits alongside SQCDP boards, Gemba walks, and Kaizen CI projects rather than off to one side as an isolated diagram. Suppliers, inputs, process steps, outputs, and customers get built directly, then displayed on a SIPOC Dashboard in card view: each card showing team, owner, department, and methodology, filterable and searchable the moment anyone needs it.
That's the part static tools can't offer. A SIPOC built in Data Point doesn't just describe a process, it's connected to the same platform tracking that process's KPIs, its Gemba audits, and its improvement projects. When the process changes, the people who own it are the same people who see the dashboard, not a separate group who happen to have the file.
This is also where Data Point's AI Intelligence layer earns its place, an AI that understands the full lean and operational context of your business, not a generic assistant bolted onto a chat window. It can flag a SIPOC that's overdue for review because the KPIs tied to that process have shifted, something a static whiteboard photo will never do.
Enterprise connectivity is the other half of the story. A SIPOC that only lives on one manager's laptop can't support a leadership team trying to see process ownership across three sites. A digital SIPOC inside a connected platform can, because the same dashboard a frontline supervisor checks are the one a plant director or ops VP can filter by site, department, or status.
The Question Worth Asking Before Your Next SIPOC Workshop
Before scheduling another whiteboard session, it's worth asking a harder question: what happens to this diagram in six months? If the honest answer is "nobody knows," that's the actual problem to solve, not the framework itself. The same question applies to whatever project comes out of that workshop - without a connected project management and tracking layer, the action items risk the same fate as the diagram itself.
Solve This with Data Point
Talk to a lean operations specialist about turning your next SIPOC workshop into a permanent, owned asset instead of another file that goes stale.
Abel Jiménez, Lean Consultant
Abel is a Lean Consultant with over 30 years of expertise in operational analysis, process improvement, and organisational change across Mexican industries. Currently serving as Director of Insurance Promotions at CESCEMEX, he helps organisations leverage technology and lean practices to improve efficiency and manage change with continuity.