Smart KPIs Explained: How to Build Effective Metrics Across Industries

Last updated on : January 23, 2026
Imagine trying to hit a target in the dark. You’ve got metrics, charts, and dashboards everywhere – but somehow, the numbers just don’t guide you. That’s what happens when KPIs aren’t designed with the team in mind. Smart KPIs flip the script: they make metrics meaningful, actionable, and actually useful for the people who rely on them every day. In this blog, we’ll unpack what smart KPIs are, how to design smart KPIs effectively, top 5 smart KPIs for decision-making roles, top 5 smart KPI examples by industry, and how smart KPIs start working in daily operations with LTS Data Point.
See how LTS Data Point brings smart KPIs into daily operations
What are smart KPIs?
Not all KPIs are created equal, we know that by now. But what makes ordinary KPIs smart? The answer is simple – they are metrics designed to be practical, relevant, and aligned with the team’s actual work. Unlike traditional KPIs that usually concentrate on reporting on useless numbers, smart KPIs offer context, lead decision-making, and assist teams comprehend exactly what drives performance. In short, they are the metrics teams can trust, interpret, and use to enhance outcomes consistently.
What makes a KPI truly “Smart”?
- Designed for action: They are designed to guide decisions and prompt meaningful action. They don’t just record numbers; they reflect where developments are required and what steps to take next.
- Owned and influenced by teams: When teams have ownership of a KPI, they understand how their work impacts it. This motivates accountability, engagement, and continuous improvement rather than metrics being imposed from above.
- Clear and understandable: Smart KPIs use simple definitions and clear calculations so that everyone interprets the same way.
- Relevant to daily work: They link directly to tasks, functions, or outcomes the team can influence, bridging the gap between strategy and execution.
- Time-sensitive and measurable: Metrics should give timely insights so teams can respond quickly, rather depending on outdated or lagging indicators.
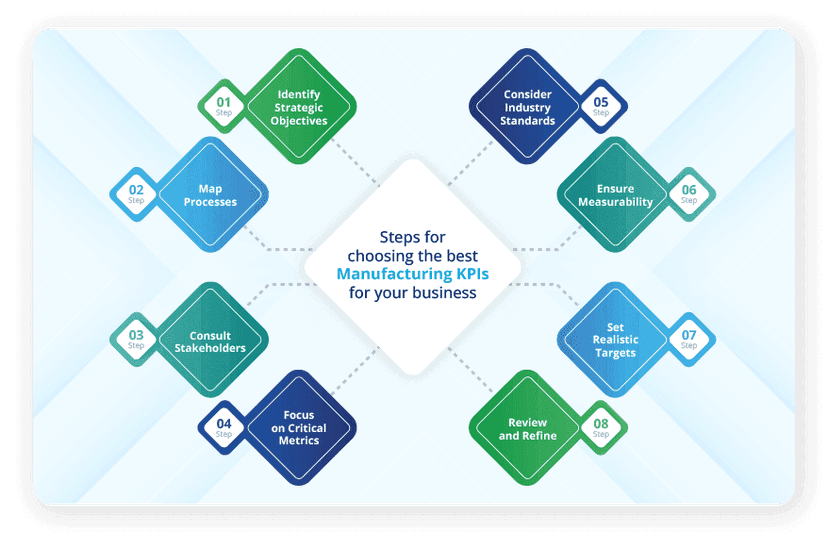
How to design smart KPIs effectively

Creating smart KPIs isn’t about generating more metrics – it's about producing the right metrics, that teams can trust, act on, and improve over time.
Let’s see the step-by-step guide on how to design smart KPIs, and build them into a KPI tree:
Begin with the decision
Identify the decisions your team needs to make. A KPI is only useful if it drives action. Ask: What decisions will this metric inform?
Understand the work context
Chart how daily processes, responsibilities, and restrictions impact the metric. Context verifies the KPI mirrors real work, not just theoretical targets.
Select relevant metrics
Pinpoint metrics that truly calculate progress toward outcomes, rather than useless numbers. Fewer, well-chosen KPIs are better than dozens of neglected ones.
Define clear computations
Make sure every KPI has clear formula and definition. Teams should know exactly what is calculated and how, avoiding ambiguity or misinterpretation.
Involve the team
Collaborate with the people executing the work. Team ownership inspires engagement and accountability and ensures the KPI mirrors practical results.
Include leading and lagging indicators
Combine outcome-based (lagging) metrics with early-warning (leading) signals. This balance enables teams to respond before problems escalate.
Set targets and benchmarks wisely
Goals should be challenging but achievable, and benchmarks should indicate realistic performance standards. Avoid arbitrary or harsh aims.
Review and evolve regularly
KPIs aren’t static. Review them periodically to make sure they stay relevant, practical, and aligned with changing processes or business goals.
For more details, click on our blog: How to Measure KPIs: All you need to know
Talk to an LTS Data Point expert about designing smart KPIs that teams use
Smart KPIs for decision-making roles
Smart KPIs look different depending on who is making decisions. A leadership role, a people manager, or an operations head all need metrics designed around their scope of influence and accountability. Below are smart KPI examples customised to key job roles, with a clear explanation of why each matter.
Smart KPIs for operations manager
Smart KPI examples for managers concentrate on flow, stability, and daily performance control.
Top 5 KPIs include:
- Cycle time: Shows how efficiently work moves from start to finish.
- Throughput rate: Helps managers understand output capacity and bottlenecks.
- Schedule adherence: Indicates how reliably plans are executed.
- Issue resolution time: Calculates responsiveness to operational disruptions.
- Process variance: Underlines instability before it impacts results.
Relevance – These smart key performance indicators (KPIs) enable managers to act early, not react late.
Smart KPIs for project managers
Here, examples of smart KPI goals focus on delivery predictability and risk control.
Top 5 KPIs include:
- Milestone achievement rate: Monitors progress against committed timelines.
- Resource utilisation: Verifies effort is balanced without burnout.
- Change request frequency: Signals scope instability.
- Risk closure rate: Quantifies how proactively risks are addressed.
- Budget variance: Keeps financial discipline visible.
Relevance – A KPI should be smart enough to guide trade-offs before delivery at risk.
Smart KPIs for people managers
These are employee smart KPI examples that balance performance with engagement.
Top 5 KPIs:
- Team capacity utilisation: Reflects sustainable workload levels.
- Skill coverage ratio: Indicates readiness to handle demand variability.
- Attrition risk indicators: Flags early signals of disengagement.
- Time to productivity: Computes effectiveness of onboarding and enablement.
- Feedback action rate: Observes whether feedback leads to change.
Relevance – This is a strong example of smart KPI design focused on people outcomes, not just numbers.
Smart KPIs for senior leaders
Leadership-level smart goals and KPI examples prioritise alignment and systemic performance.
Top 5 KPIs:
- Strategic initiative progress: Binds execution to business priorities.
- Cross-team dependency resolution time: Reveals industrial friction.
- Decision lead time: Quantifies how quickly critical decisions are made.
- Performance variability across teams: Spotlights inconsistency at scale.
- Improvement adoption rate: Shows whether change actually sticks.
Relevance – These metrics mirror smart KPI criteria; clarity, influence, and strategic relevance.
Smart KPIs for quality and compliance leaders
These smart KPI examples concentrate on risk, reliability, and prevention.
Top 5 KPIs:
- First time right rate: Reflects process capability and quality maturity.
- Audit findings trend: Tracks development, not just compliance.
- Corrective action closure time: Measures responsiveness to problems.
- Deviation recurrence rate: Underlines systemic gaps.
- Control effectiveness index: Analyses whether controls actually work.
Relevance – This aligns with smart KPI definition (metrics that drive prevention, not paperwork).
Smart KPIs for customer-facing leaders
These create a smart goals and KPI examples approach which centres on experience and responsiveness.
Top 5 KPIs:
- Customer request resolution time: Calculates service agility.
- First contact resolution rate: Reflects effectiveness at the point of contact.
- Demand vs Capacity match: Indicates service readiness.
- Repeat issue frequency: Signals unresolved root causes.
- Experience recovery rate: Monitors how well teams recover from failures.
Relevance – These KPIs support smart decision-making around service quality and trust.
For more details, check out our blogs:
- KPIs for Product Manager: Track Metrics to Drive Success
- Mastering KPIs for Operations Managers: What to Track and What to Skip
- Strategic KPIs for Quality Managers: Boosting Performance in Manufacturing
- Top KPIs for Maintenance Manager to Reduce Downtime and Costs
Explore how LTS Data Point supports role-specific smart KPIs
Smart KPI examples by industry

While the principles of smart KPIs remain consistent, the metrics themselves must mirror industry-specific priorities, risks, and decision cycles. Below are smart KPI examples tailored to different organisations.
Smart KPIs for manufacturing
- Overall equipment effectiveness (OEE): Calculates asset productivity and losses.
- Production schedule adherence: Shows planning and execution reliability.
- First pass yield (FPY): Spotlights quality at source.
- Downtime frequency: Signals process instability.
- Work-in-progress levels: Mirrors flow efficiency.
Relevance – These KPIs aid teams upgrade throughput, stability, and quality simultaneously.
Smart KPIs for automotive
- Line balance efficiency: Reflects flow consistency across stations.
- Supplier delivery reliability: Manages dependency on tiered suppliers.
- Changeover time: Assists model mix flexibility.
- Defect escape rate: Protects downstream quality.
- Inventory turnover: Balances responsiveness and cost.
Relevance – These metrics support high-volume, high-variation production environments.
Smart KPIs for healthcare
- Patient flow time: Measures efficiency of care delivery.
- Bed utilisation rate: Underlines capacity bottlenecks.
- Readmission rate: Shows care quality outcomes.
- Incident response time: Indicates patient safety readiness.
- Staff workload balance: Assists sustainable operations.
Relevance – These KPIs enhance outcomes while managing safety, capacity, and staff wellbeing.
Smart KPIs for pharmaceutical and life sciences
- Batch right first time: Computes quality and compliance together.
- Deviation closure time: Mirrors responsiveness to quality issues.
- Audit observation trends: Observes systemic improvement.
- Change control lead time: Balances agility with control.
- CAPA effectiveness rate: Makes sure corrective actions work.
Relevance – These KPIs minimise risk while maintaining regulatory discipline.
Smart KPIs for aerospace
- Programme milestone adherence: Monitors long-cycle delivery commitments.
- Non-conformance rate: Shows quality and compliance risk.
- Engineering change lead time: Balances control and adaptability.
- Supplier reliability index: Manages extended supply chains.
- Rework cost percentage: Spotlights hidden inefficiencies.
Relevance – These metrics focus on reliability, traceability, and risk management.
Smart KPIs for electronics
- Yield variability: Alerts process stability problems.
- Time to volume ramp-up: Quantifies speed from prototype to scale.
- Defect density: Protects product reliability.
- Inventory obsolescence rate: Manages rapid product lifestyles.
- Forecast accuracy: Supports demand responsiveness.
Relevance – These KPIs assist fast innovation cycles and cost control.
Smart KPIs for energy and utilities
- Asset availability: Measures reliability of critical infrastructure.
- Maintenance backlog: Shows operational risk.
- Outage response time: Mirrors service resilience.
- Safety incident frequency: Protects workforce and compliance.
- Energy loss percentage: Underlines efficiency gaps.
Relevance – These metrics focus on reliability, safety, and continuity of service.
Smart KPIs for FMCG and retail
- On-shelf availability: Computes demand fulfilment.
- Inventory turnover: Balances freshness and working capital.
- Promotion forecast accuracy: Minimises waste and stock-outs.
- Order fulfilment cycle time: Indicates responsiveness.
- Returns rate: Flags quality or demand mismatches.
Relevance – These KPIs help manage high-volume, demand-driven operations.
Smart KPIs for banking and finance
- Transaction processing time: Measures operational efficiency.
- Error rate: Indicates process quality and risk.
- Customer request resolution time: Mirrors service responsiveness.
- Compliance exception trends: Tracks control effectiveness.
- Cost per transaction: Balances efficiency and scalability.
Relevance – These metrics support reliability, compliance, and customer trust.
Smart KPIs for construction
- Schedule variance: Observes delivery predictability.
- Cost variance: Reflects financial control.
- Rework percentage: Spotlights quality issues.
- Safety incident rate: Protects workforce and timelines.
- Resource utilisation: Manages productivity on-site.
Relevance – These KPIs help manage risk, cost, and coordination across projects.
Smart KPIs for service industries
- Request resolution time: Measures service efficiency.
- First contact resolution rate: Mirrors service effectiveness.
- Demand vs Capacity match: Supports workforce planning.
- Repeat issue frequency: Underlines root cause gaps.
- Customer satisfaction trend: Observes experience over time.
Relevance – These metrics prioritise responsiveness, quality, and consistency.
Smart KPIs for off-highway and synthetic
- Equipment availability: Quantifies readiness of critical assets.
- Failure frequency: Mirrors reliability issues.
- Maintenance compliance rate: Protects asset life and safety.
- Spare parts availability: Reduces downtime risk.
- Lifecycle cost per asset: Supports long-term decision-making.
Relevance – These KPIs address high-value assets, harsh operating conditions, and long lifecycles.
Discuss your smart KPI challenges with an LTS Data Point expert
When smart KPIs start working in daily operations with LTS Data Point
Designing smart KPIs is only half the work. They start delivering real value when they are embedded into daily operational rhythms, visible to teams, and linked to decisions. It is important to always choose the right KPI tracking software with the best KPI monitoring system features. This is where digital performance management platforms like LTS Data Point play a crucial role – by moving smart KPIs from static reports into active, decision-support tools used every day.
How LTS Data Point helps smart KPIs work in practice
- Makes smart KPIs visible where work happens: Smart KPIs are displayed in a clear, role-relevant way, ensuring teams see the right metrics at the right time – not buried in spreadsheets or slide decks.
- Links metrics to daily reviews and meetings: KPIs are integrated into routine performance conversations, helping teams move from status reporting to problem-solving and action planning.
- Adds context around numbers: Instead of isolated values, teams can view trends, comparisons, and performance patterns, making it easier to understand why a KPI is moving.
- Supports consistent metrics across levels: The same smart KPIs can be viewed at team, function, and leadership levels – maintaining a single source of truth while allowing different perspectives.
- Enables faster, fact-based decisions: With updated and structured performance data, managers can respond early to risks, deviations, or improvement opportunities.
- Lowers manual monitoring and reporting effort: By digitising KPI tracking, teams spend less time compiling data and more time acting on insights.
- Motivates continuous improvement: Smart KPIs become part of an ongoing performance cycle – reviewed, discussed, and refined as processes and priorities evolve.
Smart KPIs work when they reflect real work, real decisions, and real accountability. Across roles and industries, the most effective KPIs are the ones teams understand, influence, and use every day – not just review at month-end. When designed with clarity and supported by the right digital systems, smart KPIs shift performance management from reactive reporting to proactive decision-making. The result is not more metrics, but better focus, earlier signals, and outcomes teams can trust.
Get guidance from an LTS Data Point expert on making KPIs practical
FAQs
1. How many smart KPIs should a team track at one time?
Most teams perform best with 5-9 smart KPIs. Tracking more than this dilutes focus and slows decision-making, especially in daily or weekly reviews.
2. How often should smart KPIs be reviewed?
Smart KPIs should be reviewed as frequently as decisions are made – daily for frontline teams, weekly for managers, and monthly for leadership.
3. Can smart KPIs change over time?
Yes. Smart KPIs should evolve as process maturity, priorities, or operating conditions change, while still maintaining continuity for trend analysis.
4. What is the difference between lagging and leading smart KPIs?
Lagging smart KPIs measure outcomes already achieved, while leading smart KPIs act as early signals, helping teams intervene before performance slips.
5. Who should own a smart KPI?
Ownership should sit with the team or role that can directly influence the outcome, not just the function that reports the number.
6. Are smart KPIs only useful for managers?
No. Smart KPIs are most effective when frontline teams, managers, and leaders all use them – each at the level where decisions are made.
7. How do smart KPIs support cross-functional alignment?
Smart KPIs create alignment by using shared definitions, consistent measures, and common review rhythms across functions.
8. What happens when teams disagree on KPI definitions?
Disagreement usually signals unclear intent. Clarifying decision purpose, data source, and ownership resolves most KPI definition conflicts.
9. Can qualitative metrics be part of smart KPIs?
Yes. When clearly defined and consistently reviewed, qualitative indicators can complement numeric KPIs, especially in service and knowledge roles.
10. How do smart KPIs reduce firefighting?
By surfacing early trends and deviations, smart KPIs enable teams to act sooner – reducing last-minute escalations and reactive fixes.