QCD Management: How Manufacturers Use Quality, Cost and Delivery to Drive Performance
QCD management integrates quality, cost, and delivery into a unified operational framework, helping manufacturers improve performance through QCD boards.
Contents
- What Is QCD in Manufacturing? (And Why Most Teams Get It Wrong)
- The Three Pillars; Quality, Cost and Delivery Explained
- Why QCD Fails When the Pillars Are Managed in Silos
- What Is a QCD Board and How Does It Work in Practice?
- What a QCD Board Tracks Shift by Shift
- How QCD Connects to Your Tier Meetings and Escalation Process
- QCD vs SQCDP vs SQDC - Which Framework Does Your Operation Need?
- Key QCD Metrics Every Plant Manager Should Be Tracking
- From QCD to Connected Operations - How Leading Manufacturers Are Closing the Gap
- How to Implement QCD Management in Your Facility: A Practical Starting Point
Last updated on : September 30, 2026
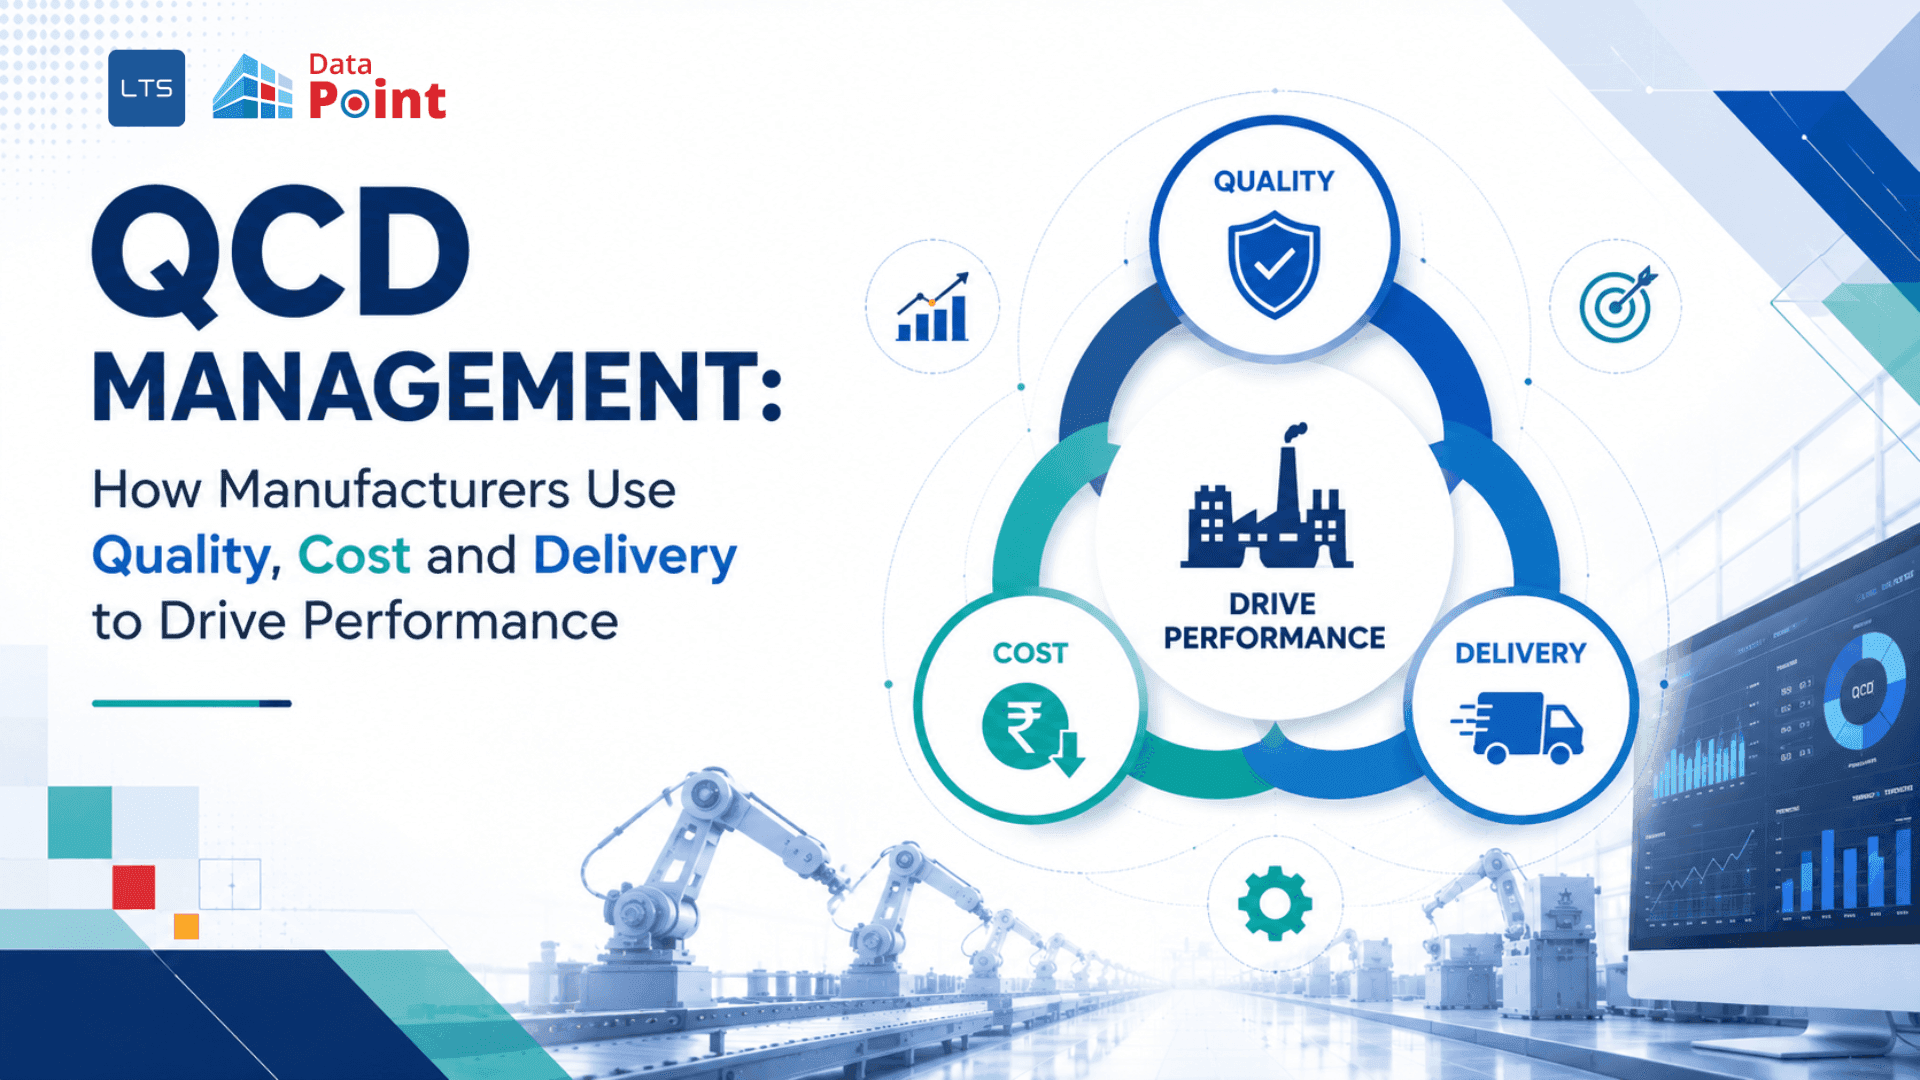
QCD stands for Quality, Cost and Delivery. It is a manufacturing performance framework that measures product conformance, operational cost efficiency and on-time delivery against set targets. Used in lean and daily management systems, QCD aligns frontline teams with operational goals across every shift.
What Is QCD in Manufacturing? (And Why Most Teams Get It Wrong)
Most manufacturers track quality. Most track cost. Most track delivery. Very few track all three together in one place and fewer still understand how movement in one pillar directly affects the others.
That gap is where performance problems hide.
A plant hitting 99% quality compliance but running 15% behind on delivery targets has not solved its problem it has simply moved it. QCD in manufacturing exists to make those interdependencies visible, measurable and actionable every single day.
The Three Pillars; Quality, Cost and Delivery Explained
Quality
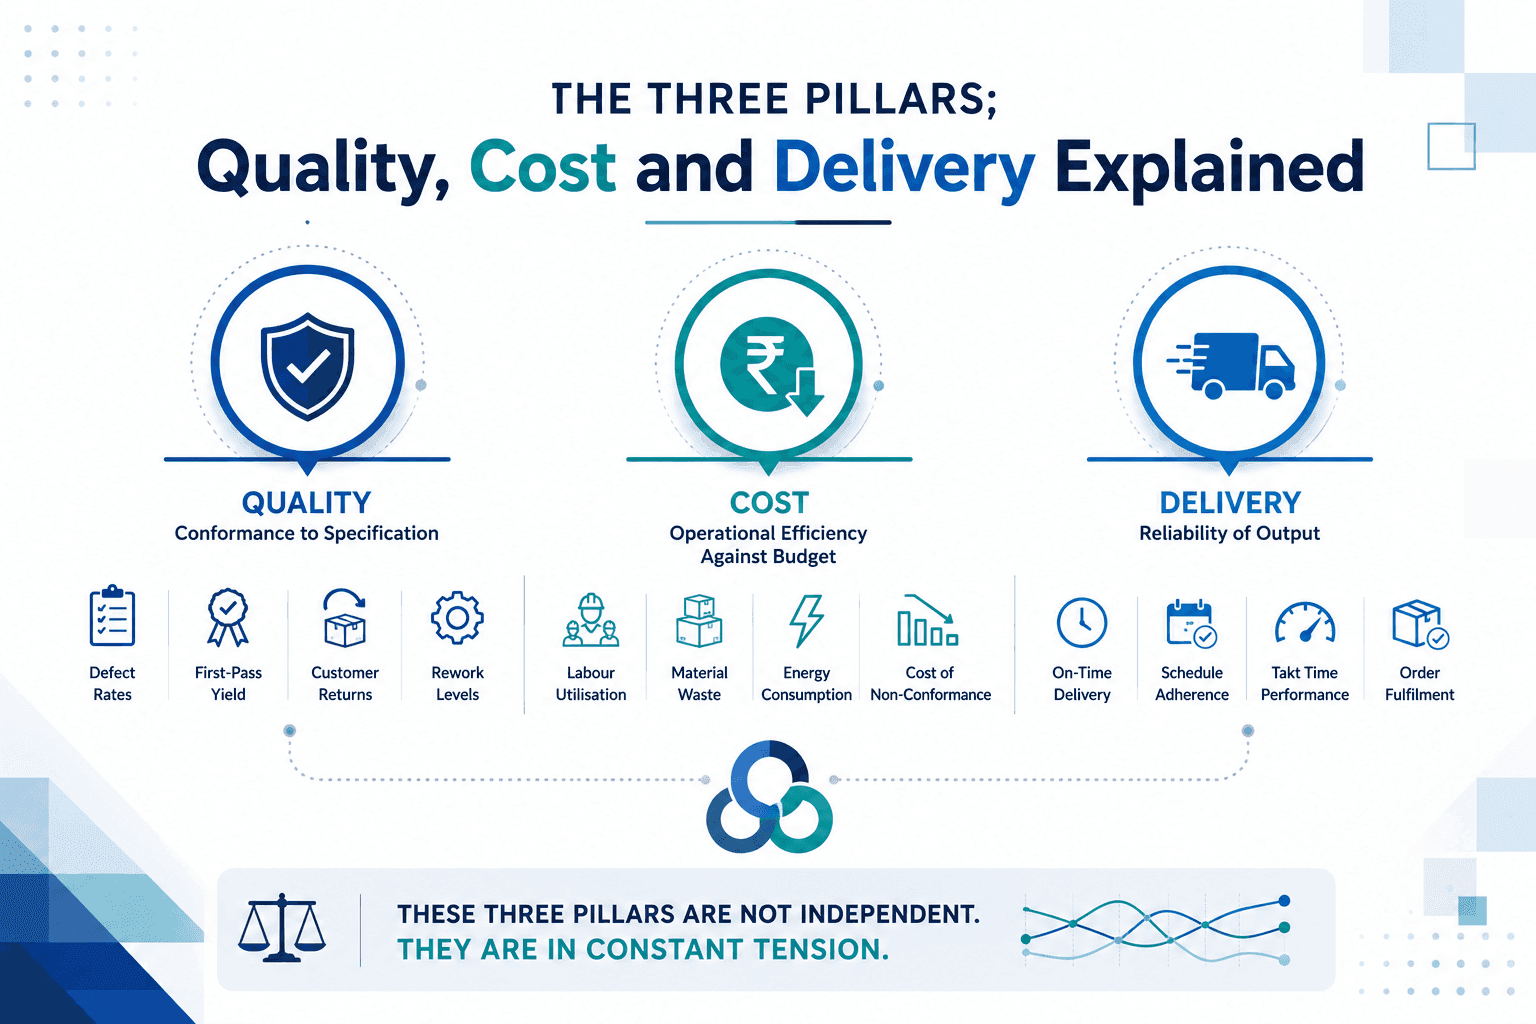
Measures conformance to specification. Defect rates, first-pass yield, customer returns and rework levels all fall here. In automotive plants, quality is tracked per part number and per shift. In pharma and life sciences environments, it maps to batch release rates and deviation incidents.
Cost
Measures operational efficiency against budget. Labour utilisation, material waste, energy consumption and the hidden cost of non-conformance - scrap, rework and unplanned stoppages, all carry a cost that weekly reports rarely surface in time to act on.
Delivery
Measures the reliability of output. On-time delivery, schedule adherence, takt time performance and order fulfilment rates tell you whether the operation is keeping its commitments to the next process, the next shift, or the end customer.
These three pillars are not independent. They are in constant tension.
Still pulling QCD data from three different systems every Monday morning?
There is a better way. LTS Data Point AI operational excellence software gives your teams live quality, cost and delivery visibility; every shift, every plant, without the manual work.Why QCD Fails When the Pillars Are Managed in Silos
Quality is owned by the QA team. Cost is owned by finance. Delivery is owned by production planning. Three teams, three systems, three weekly reports and by the time anyone sees the full picture, the window to act has already closed.
Silo management also hides the trade-offs. Teams under delivery pressure speed up production, which drives quality escapes. Teams under cost pressure cut planned maintenance, which drives unplanned downtime. Every decision looks rational inside the silo. Across the three pillars, it is a slow leak.
QCD management is the discipline of tracking all three in one place, at the same cadence, so trade-offs become visible before they become crises. This is the backbone of any serious manufacturing process improvement programme.
What Is a QCD Board and How Does It Work in Practice?
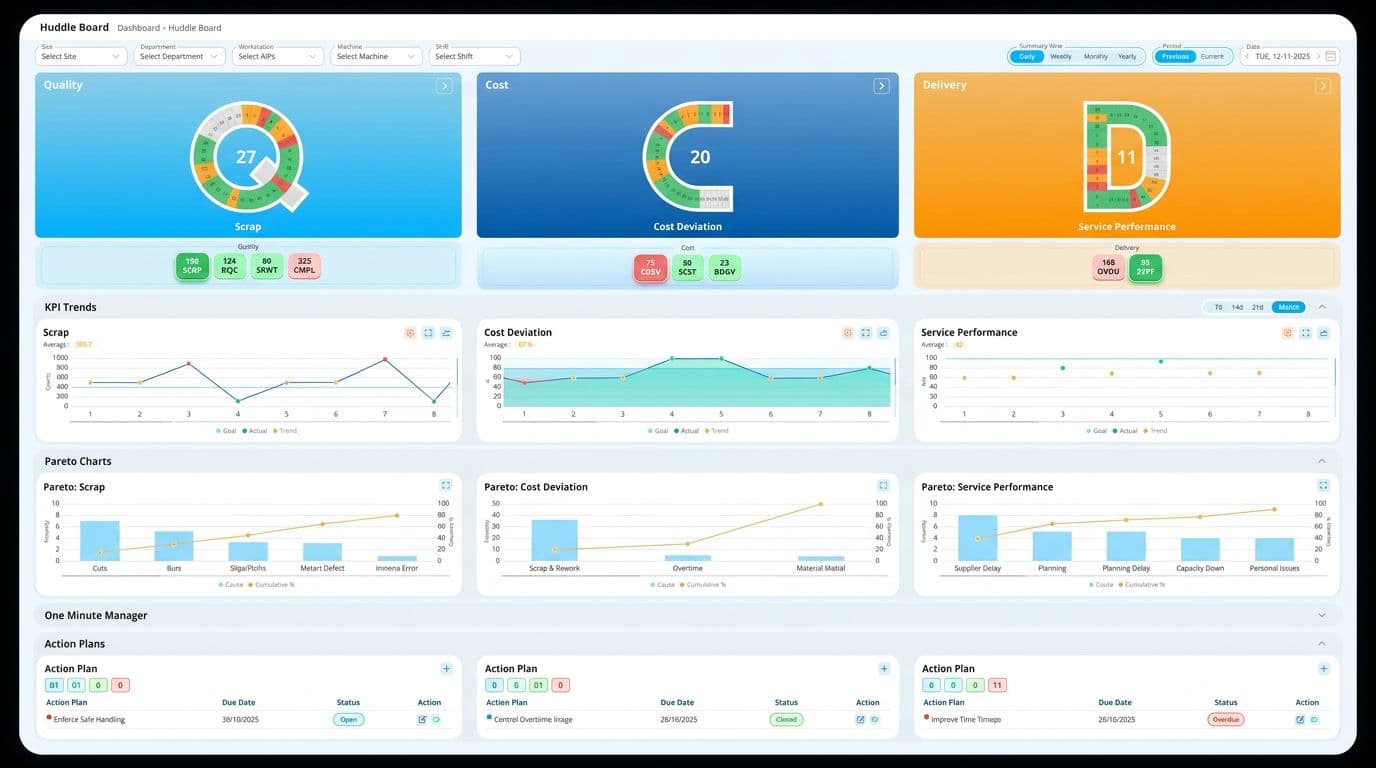
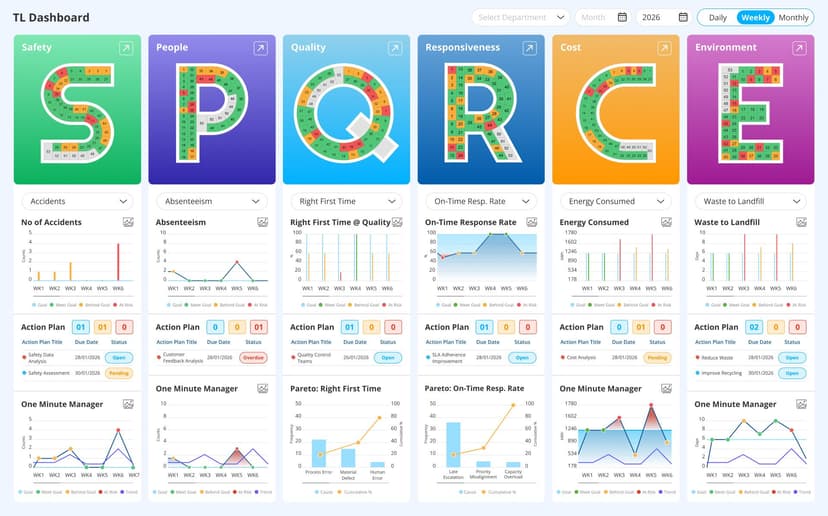
A QCD board is a visual management tool, physical or digital that displays performance against quality, cost and delivery targets in a single view. It is the operational centrepiece of daily QCD management, reviewed at shift handovers, morning meetings and tier escalation points.
What a QCD Board Tracks Shift by Shift
A well-structured QCD board shows:
- Quality: Defects per shift, first-pass yield, rework volumes, customer complaints
- Cost: Output vs. target, OEE, waste levels, overtime hours
- Delivery: Schedule adherence, on-time completion, takt time variance, line stoppages
Red/amber/green (RAG) status against each metric gives teams an immediate read of where the shift stands. More importantly, it surfaces the ‘why “linked action logs, escalation flags and problem-solving records sit alongside the metrics so issues do not just get recorded, they get owned.
This connects naturally to manufacturing KPI dashboards and continuous improvement metrics that track cumulative trends over time.
Why Manual QCD Boards Break Down at Scale
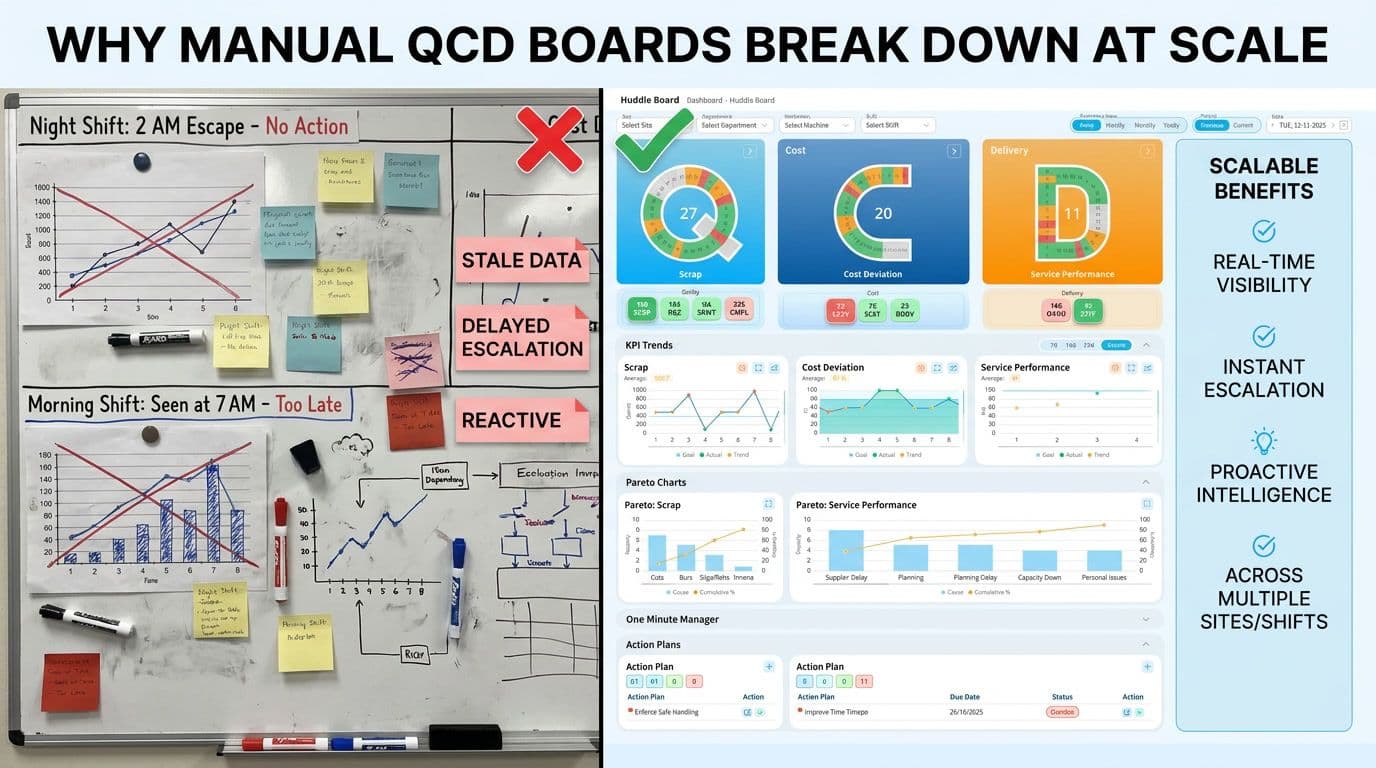
The whiteboard QCD board works in a single cell with a stable team. It breaks down the moment you have multiple shifts, multiple lines or multiple plants.
Manual boards go stale between updates. Night shift records a quality escape at 2am. The morning manager sees it at 7am - five hours after it happened, with no escalation, no interim action and no context. By the time the data reaches leadership, it is history, not intelligence.
The difference between reactive and proactive operations consistently comes down to the speed and accuracy of data at the point of decision. Manual QCD boards lose that race every time.
QCD Management: Running It as a Daily Rhythm, not a Weekly Review
The most common misapplication of QCD is treating it as a reporting format rather than a management system. Weekly QCD reviews are useful for trend analysis. They are useless for operational control.
QCD management works when it is embedded in the daily rhythm of the operation at shift start, shift handover and each morning meeting. It becomes the shared language between frontline teams and operational leaders.
How QCD Connects to Your Tier Meetings and Escalation Process
In a tiered daily management structure, QCD is the data layer that drives each tier:
- Tier 1 (frontline team): Reviews the QCD board at shift start and shift end. Raises issues, logs actions, flags escalations.
- Tier 2 (supervisor/manager): Reviews unresolved issues from Tier 1 and cross-shift trends.
- Tier 3 (plant/operations leadership): Reviews systemic QCD patterns and connects performance to strategic targets.
This is how QCD becomes more than a board — it becomes the escalation backbone of lean daily management. Without it, tier meetings are conversations. With it, they are decisions.
The Cross-Pillar Tension - When Hitting One Metric Breaks Another
Every operations leader has lived this: the quarter-end delivery push that generates a spike in quality escapes the following month. Or the cost-reduction initiative that reduces inspection frequency and drives a customer return six weeks later.
The cross-pillar tension is not a sign that QCD is failing. It is precisely what QCD management is designed to expose. When all three metrics are visible in one place, every shift, the trade-off decisions become explicit, and accountable.
QCD vs SQCDP vs SQDC - Which Framework Does Your Operation Need?
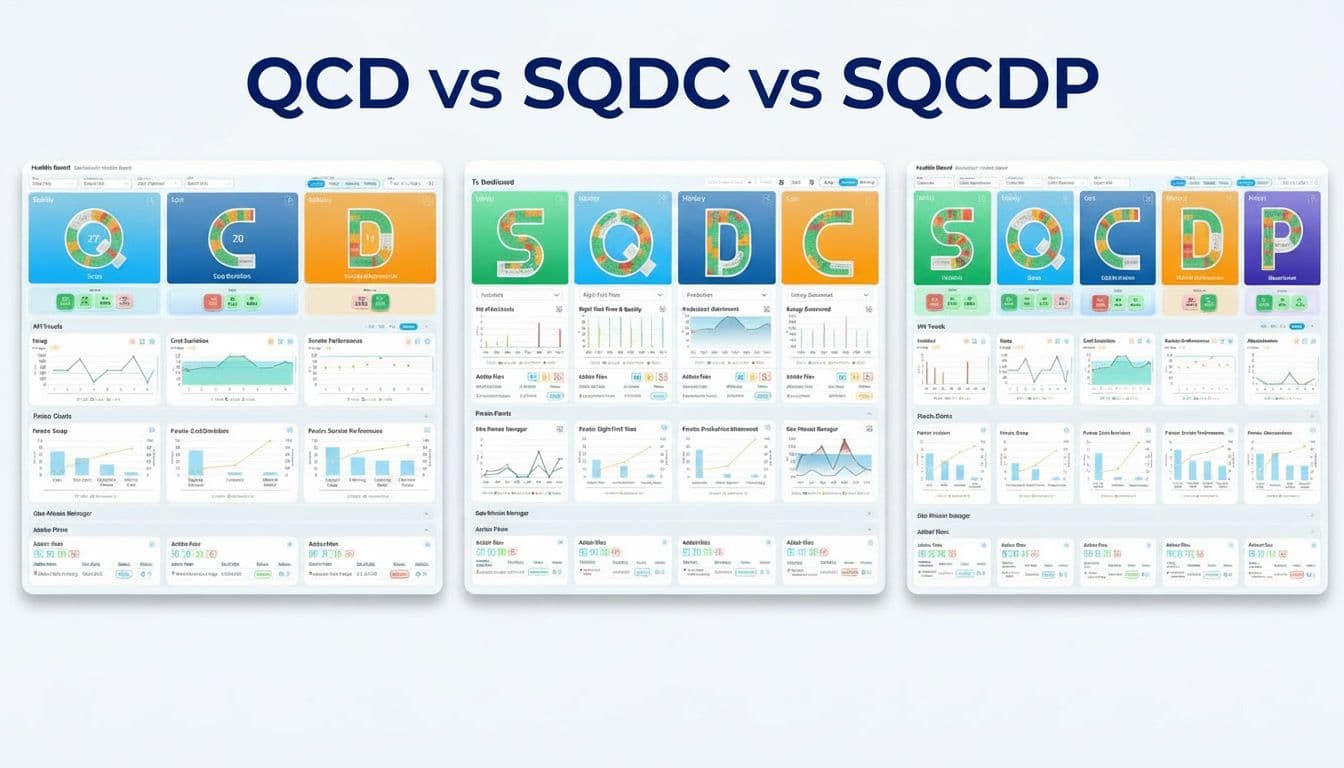
QCD is the core. Most manufacturing operations extend it to capture additional priorities specific to their environment.
The right choice depends on which operational risk carries the most weight in your environment. For most mid-to-large manufacturers, SQCDP is the natural evolution from QCD — adding safety and people reflects the broader accountability of a mature lean operation. See how SQDCP compares to PQVC metrics to find the right fit for your operation.
Key QCD Metrics Every Plant Manager Should Be Tracking
From QCD to Connected Operations - How Leading Manufacturers Are Closing the Gap
Why Disconnected Systems Kill QCD Visibility
Most manufacturers already measure quality, cost and delivery. The problem is where that data lives.
Quality sits in the QMS. Cost sits in the ERP. Delivery sits in the MES or production planning tool. Pulling a unified QCD view means exporting spreadsheets, emailing figures and manually assembling a picture that is already 24 to 72 hours out of date by the time it reaches the right person.
That is not QCD management. That is QCD archaeology.
The shift from reactive to proactive operations requires all three pillars to be visible in one place, updated in real time and connected from the shop floor to the boardroom.
What Changes When QCD Is Live, Connected and AI-Informed
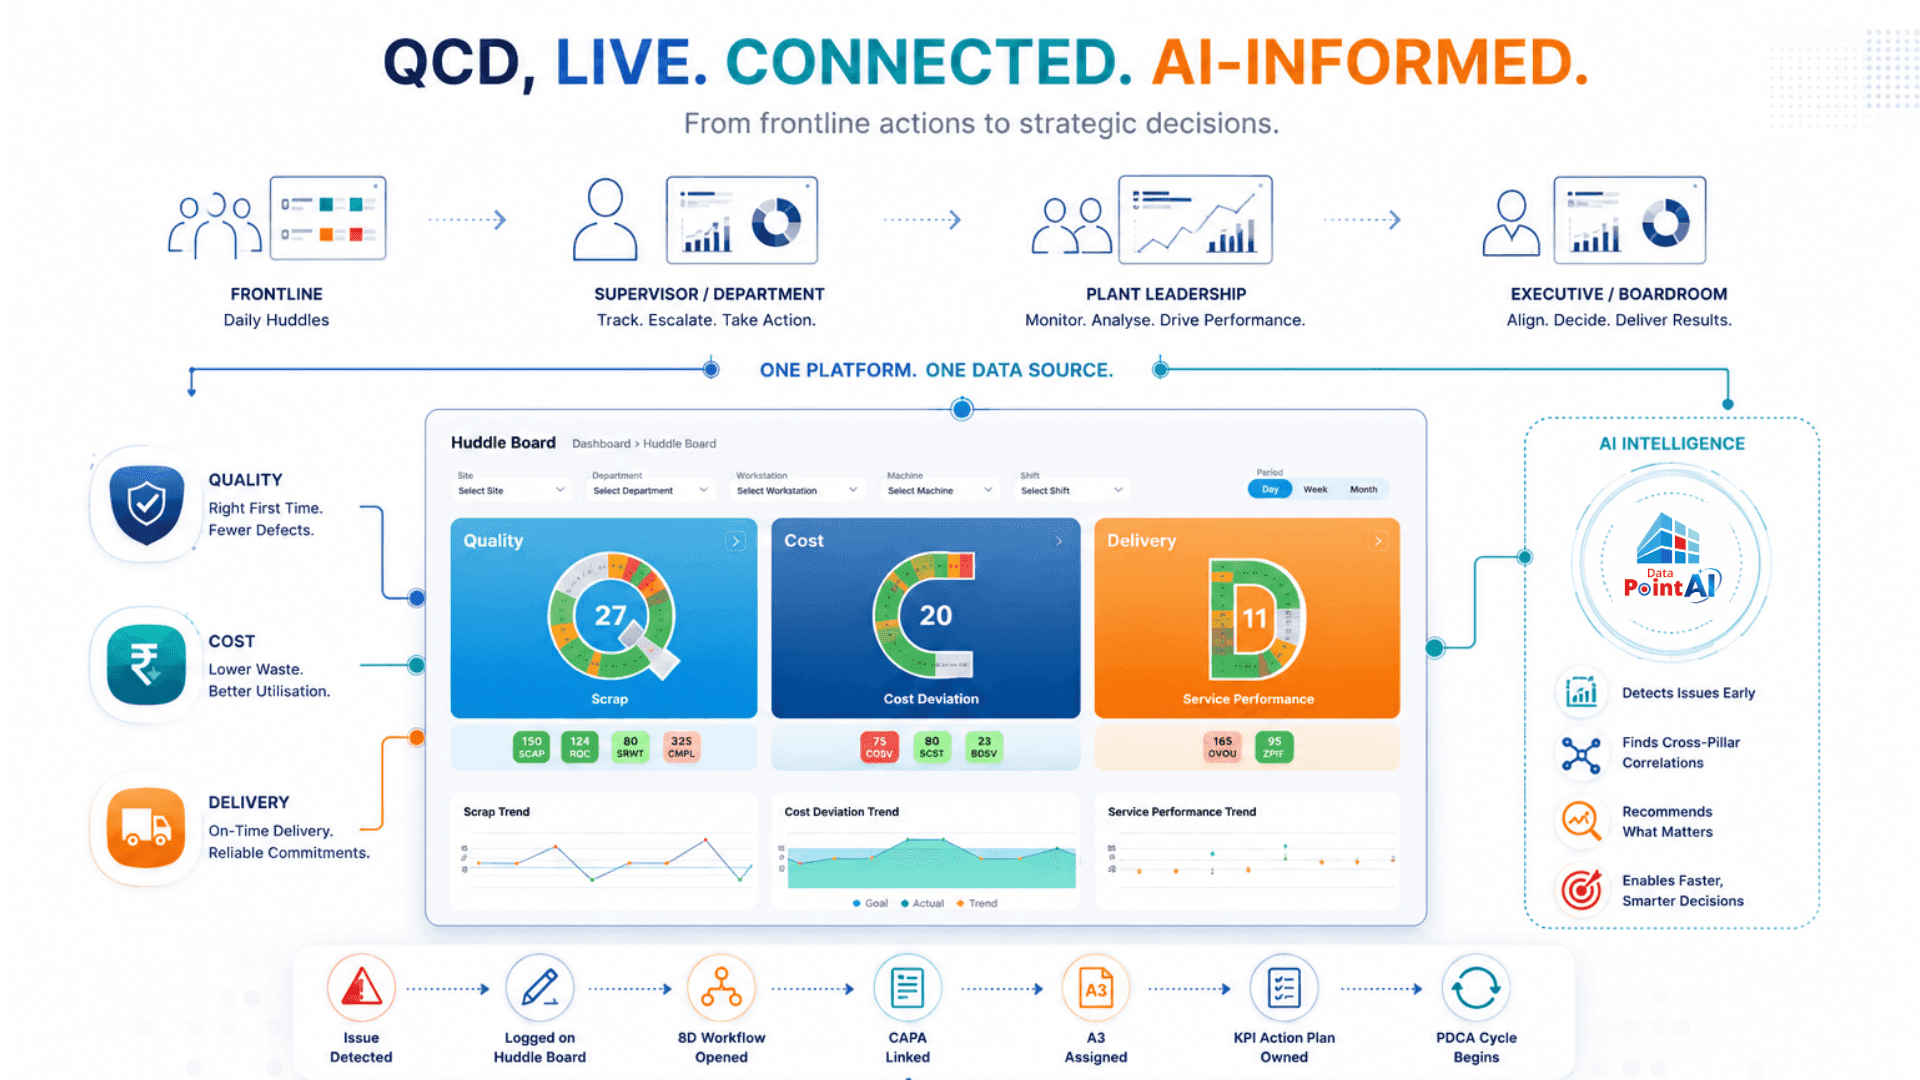
Data Point is a connected operational intelligence platform built for mid-to-large manufacturers. It brings QCD management to life across the full operational hierarchy from frontline team boards to leadership dashboards without requiring manual data consolidation.
How to Implement AI driven QCD Management?
Within Data Point's Lean Daily Management capability, QCD tracking is embedded in the daily operational rhythm. Teams work from live digital huddle boards that surface quality, cost and delivery status every shift. Escalation paths are built in. Action ownership is tracked. The full framework family - SQCDP, SQDIP, SQDCM, PQVC - is available within the same platform, so operations can evolve their framework without changing their system.
When a quality escape occurs on the night shift, Data Point surfaces it in real time. The supervisor logs the issue directly on the board. An 8D problem-solving workflow opens. A CAPA record is linked. An A3 is assigned. The KPI action plan is owned before the shift ends and a PDCA cycle begins.
Data Point AI Intelligence sits across all of this — not as a generic chatbot, but as an AI that understands the full lean and operational context of your business. It identifies QCD trends before they breach targets, flags cross-pillar correlations and gives leaders the data they need to make the right call, shift by shift, plant by plant. Data into decisions.
The manufacturing balanced scorecard layer connects QCD performance to strategic goals, so the frontline view and the boardroom view are always aligned.
Manufacturers running connected QCD management cut response time from days to minutes.
See how Data Point turns quality, cost and delivery data into real-time operational intelligence - across every shift and every plant.How to Implement QCD Management in Your Facility: A Practical Starting Point
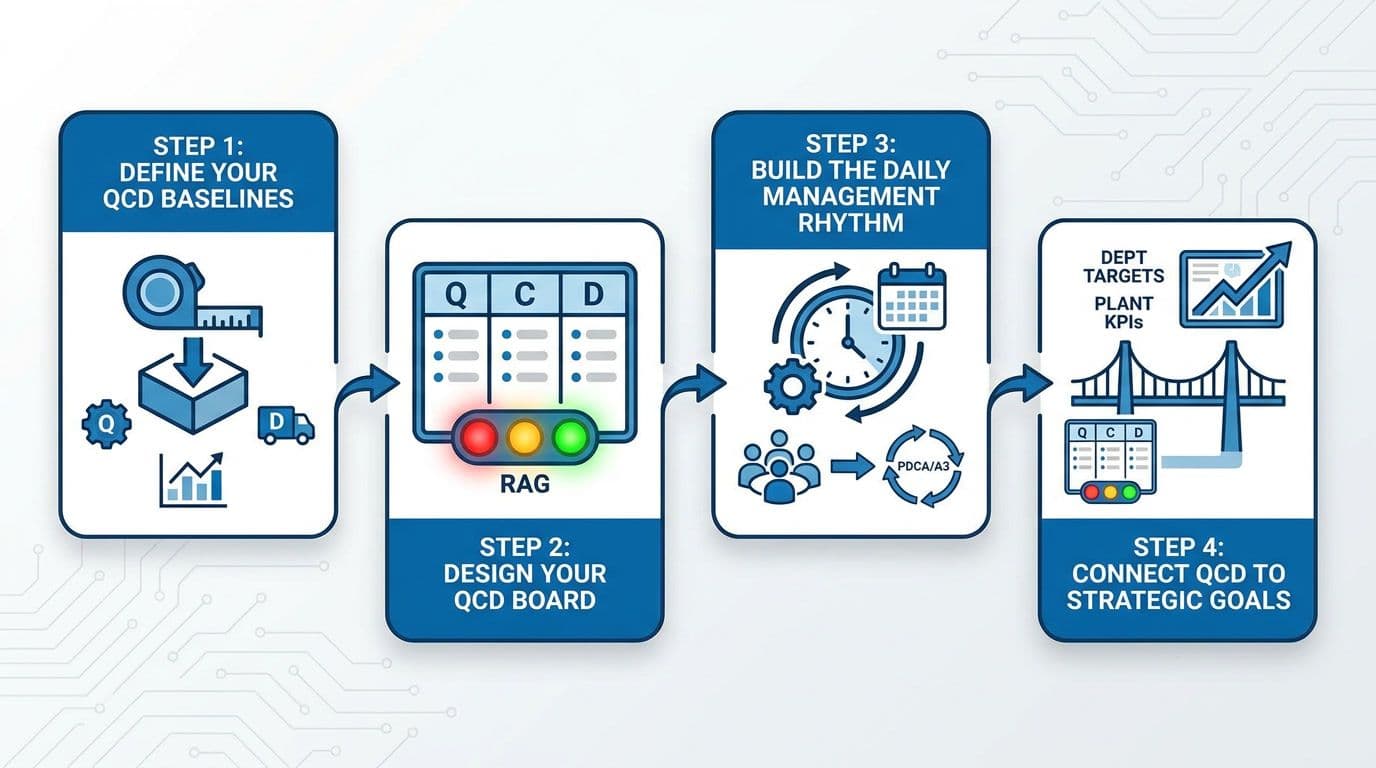
Define Your QCD Baselines
Before you can manage QCD, you need to know where you stand. Pull the last 90 days of quality, cost and delivery data and establish a baseline for each pillar. This is your "from" state - the reference point against which every improvement is measured.
Design Your QCD Board
Decide what each pillar tracks in your operation. Keep it to three to five metrics per pillar. The goal is clarity, not completeness. A board with 30 metrics is a report. A board with 12 focused metrics is a management tool. Define RAG thresholds for each metric — red means action required now, amber means a trend to watch, green means on track.
Build the Daily Management Rhythm
The board is only as good as the process around it. Establish a daily review cadence — shift start, shift handover, morning meeting — and assign clear ownership for every metric. Every red or amber status needs an owner, a deadline and a linked action before the next review. Connect this to your PDCA cycle and A3 problem-solving process so issues that cannot be resolved at Tier 1 escalate with the right information already attached.
Connect QCD to Strategic Goals
QCD without strategic context is operational noise. Connect your QCD metrics upward — to department targets, plant KPIs and the strategic plan. When a frontline team understands how their shift-level quality rate affects annual delivery performance, QCD management becomes a shared language, not a management task. This is where the manufacturing balanced scorecard plays a connecting role across the hierarchy.