KPI Examples: The complete resource for tracking, analysing for achieving strategic goals
Key Performance Indicators help organisations measure progress, improve decisions, and stay aligned with strategic goals. This guide explains what KPIs are, how to choose them, how to report them, and how different teams use them in practice.
Contents
- What are KPIs?
- The Five Elements of a KPI
- Types of KPIs or KPI categories
- Why are KPIs important for businesses?
- What is the difference between a KPI and a metric?
- KPI Report vs KPI Dashboard vs KPI Template
- KPI Report
- KPI dashboard
- KPI Template
- What is a KPI Checklist?
- Common KPI Challenges
- KPI tracking software: How it becomes the solution to manual KPI challenges?
- Examples of Key Performance Indicators
- Industry-Specific KPIs
- Other KPI Examples by Category
- KPI Examples in Manufacturing and Operations
- How do you measure KPIs?
- What are SMART criteria for setting KPIs?
- Best Practices and Tips for KPI Tracking
- How can benchmarking help in setting KPI targets?
- How can businesses effectively communicate KPIs across teams?
- Summary
Last updated on : June 10, 2026
Key Takeways
What are KPIs?

A KPI, stands for- Key Performance Indicator, is a measurable value used to track progress against a business objective.
In simple terms, KPIs show whether performance is moving in the right direction. They help organisations focus on what matters most, monitor results, and act early when improvement is needed.
Start your KPI journey today
Learn how to implement KPIs in your organisation ―for better resultsKPI meaning in business
The KPI meaning in business is straightforward: a KPI is not just any number. It is a metric linked to a goal that matters to the organisation.
For example:
- Revenue is a metric.
- Revenue growth against target is a KPI.
- Number of customer complaints is a metric.
- Reduction in complaint rate against service target is a KPI.
Why KPIs matter
KPIs matter because they:
- turn goals into measurable outcomes
- help leaders and teams focus attention
- improve accountability
- support better decision-making
- reveal trends, risks, and opportunities
- connect strategy to day-to-day activity
Without KPIs, businesses often collect data but struggle to use it effectively.
The Five Elements of a KPI
Types of KPIs or KPI categories
Key Performance Indicators (KPIs) help organisations to measure their progress towards achieving strategic and operational goals. Understanding the different categories of KPIs helps businesses align their activities with their objectives, optimise performance, and achieve sustainable growth.
➤ Strategic KPIs
Strategic KPIs are high-level metrics that reflect an organisation's overall health and long-term objectives. These KPIs align with the company's vision, mission, and strategic goals, providing a clear picture of the organisation's direction and success over time. Strategic KPIs are crucial for C-level executives and senior management to assess whether the company is on track to meet its overarching goals. They guide decision-making at the highest levels and ensure all departments align with the company's strategic plan.
Examples:
➢ Revenue Growth Rate: Measures the increase in revenue over a specific period.
➢ Market Share: Indicates the company's portion of the market compared to competitors.
➢ Customer Lifetime Value (CLV): Predicts the total revenue a business can probably make from a single customer account.
➤ Operational KPIs
Operational KPIs are used to mark the efficiency and effectiveness of day-to-day operations. These KPIs measure the performance of processes, projects, and activities that are critical for the smooth functioning of the business. Operational KPIs are vital for middle management and operational teams to monitor and improve the efficiency of daily activities. These metrics help identify bottlenecks, streamline processes, and enhance productivity.
Examples:
➢ Cycle Time: The time it takes to complete one process cycle.
➢ Inventory Turnover: Measures how often inventory is sold and replaced over a period.
➢ Average Handling Time: The average time to handle a customer inquiry or service request.
➤ Functional KPIs
Functional KPIs are specific to particular departments or functions within an organisation. These metrics measure the performance of individual units in areas such as marketing, sales, finance, HR, and customer service. Functional KPIs are critical for department heads and managers to assess and optimise the performance of their teams. These KPIs ensure that each function contributes effectively to the organisation's overall objectives.
Examples:
➢ Sales Conversion Rate: The total percentage of leads that convert into actual sales.
➢ Marketing ROI: Return on Investment (ROI) required for marketing campaigns.
➢ Employee Turnover Rate: The rate at which employees leave the company within a certain period.
➤ Leading and Lagging KPIs
- Leading KPIs: Predictive metrics that indicate future performance. They are proactive and help anticipate outcomes, allowing businesses to take preventive measures. Leading KPIs are essential for forecasting and planning, helping organisations anticipate changes and adapt strategies accordingly.
Examples:
➢ Number of New Leads: Indicates potential future sales.
➢ Employee Training Hours: Suggests future improvements in employee performance.
- Lagging KPIs: Reflect past performance. They are reactive and show the results of actions already taken, providing a historical view of performance. Lagging KPIs, on the other hand, are crucial for evaluating the effectiveness of past actions and understanding trends over time.
Examples:
➢ Quarterly Sales Revenue: Shows sales performance over the last quarter.
➢ Customer Satisfaction Score: Reflects the quality of customer experience based on past interactions.
Why are KPIs important for businesses?
KPIs give structure to performance management. They help organisations move from assumptions to evidence.
A good KPI system can help businesses:
- track progress toward strategic goals
- identify performance gaps early
- align departments around shared priorities
- improve review meetings
- support faster corrective action
- create a culture of continuous improvement
In practice, KPIs are most effective when they are reviewed regularly and linked to ownership and action.
What is the difference between a KPI and a metric?
KPI Report vs KPI Dashboard vs KPI Template
These terms are related, but they are not the same.
KPI Report
A KPI report is a structured document that provides a concise overview of KPIs (Key Performance Indicators) relevant to an organisation’s objectives and performance targets. It typically includes graphical representations and numerical data that track KPIs over a specific period.
KPI reporting aims to present:
- Actionable insights and trends
- Informed decision-making by highlighting successes
- Improvement areas
- Progress towards strategic goals
These reports are crucial for monitoring performance, assessing the effectiveness of strategies, and ensuring alignment with organisational objectives.
Manual KPI Reports (Excel-Based)
Manual KPI reports rely on collecting and compiling data from different sources using Excel. This process takes time and increases the chances of manual errors. Data is usually not updated in real time, making it harder to track performance accurately. Visualisation is also limited, which can make it difficult to clearly understand production, quality, and supply chain performance.
Automated KPI Reports
Automated KPI reports provide real-time data updates and collect data automatically from multiple sources such as ERP systems. This reduces manual effort, improves accuracy, and saves time in report generation and analysis. With customisable dashboards and interactive charts provided by KPI software like LTS Data Point, business can easily understand complex data and gain better insights into production efficiency, quality metrics, and overall performance.
Read , how to build and automate a Digital KPI Tree.
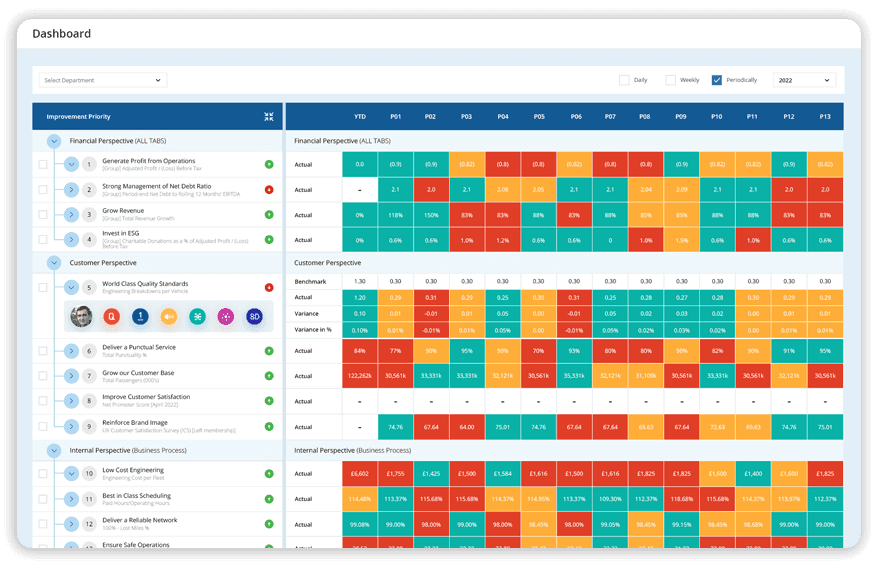
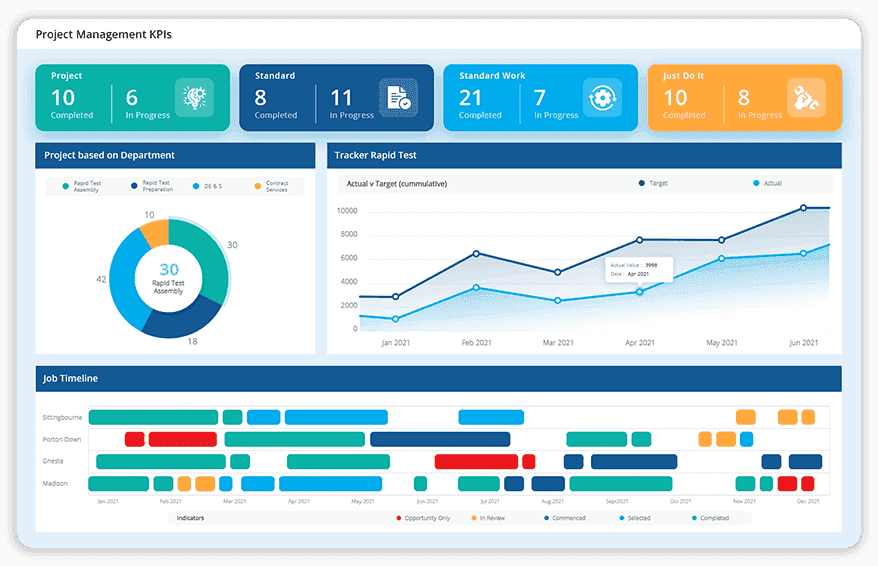
KPI dashboard
A KPI dashboard visually consolidates and displays KPIs for monitoring the health and performance of an organisation in real-time. It present the KPI trends, overall summary, KPI failures, action plans and measurements through diffrent visualisation methods.
The benefits of using KPI dashboards include:
- Improved decision-making.
- Enhanced transparency across teams.
- The ability to quickly identify areas that need attention or improvement.
- Overall KPI management
KPI Dashboard Examples includes:
- Operational Efficiency Dashboard
- Marketing Campaign Dashboard
- Sales Performance Dashboard
- Manufacturing KPI Dashboard
- Supply Chain KPI dashboard
KPI Template
A KPI template is a ready-to-use framework that gives structure and visibility to performance tracking. It helps teams organise, record, and reuse KPI data in a consistent way, making it easier to monitor progress and stay aligned with business goals.
Key Elements
- Defines strategic, operational, and functional KPIs in one structured format
- Includes leading and lagging indicators for better tracking
- Allows teams to fill, update, and reuse data easily
- Improves visibility, consistency, and accountability across teams
What includes in a KPI template?
A good KPI template may include:
- KPI name
- business objective
- definition
- formula
- target
- owner
- frequency
- data source
- threshold rules
- related action plan
A KPI tracking template is useful when teams are still building their reporting discipline. A KPI scorecard template is useful when KPIs are grouped around strategic perspectives, departments, or performance themes.
Get The Free KPI templates Powered by LTS Data Point KPI system
What is a KPI Checklist?
A KPI checklist is a simple tool used to make sure your KPIs are properly set up and useful. It helps you confirm that each KPI is clear, measurable, and actually supports business decisions, not just tracking numbers.
Think of it as a quick validation before you start tracking or reviewing KPIs.
Sample KPI Checklist (Use Before Finalising KPIs)
Use this checklist for each KPI:
- Is this KPI linked to a clear goal?
- Do I understand exactly what is being measured?
- Is there a clear formula or calculation?
- Is there a defined target to achieve?
- Who is responsible for this KPI?
- Where does the data come from? (system/source)
- How often will this KPI be reviewed? (daily/weekly/monthly)
- Can this KPI be visualised on a dashboard or chart?
- If this KPI goes off track, do we know what action to take?
Common KPI Challenges
Businesses often struggle with KPIs for the same reasons.
Lack of clarity
Teams measure too many things without deciding what matters most.
Poor data quality
Inconsistent data sources undermine trust in results.
Weak ownership
No one is clearly responsible for improving the KPI.
Too much manual reporting
Spreadsheet-heavy processes slow down visibility and action.
No link to strategy
Teams track activity, but not outcomes.
Poor communication
KPIs are reported, but not understood or used.
KPI tracking software: How it becomes the solution to manual KPI challenges?
Modern KPI tracking software eliminates these limitations by centralising data, automating updates, and transforming KPI tracking into a real-time, actionable performance system. Instead of static reports, organisations gain continuous visibility, faster decision-making, and structured accountability.
Read the comprehensive guide of KPI tracking for getting more practical insights.
How to track KPIs effectively with KPI software?
As an example, have a look on LTS Data Point KPI tracking software which is designed to go beyond basic tracking. It connects KPI measurement with analysis, problem-solving, and execution, ensuring that every KPI drives meaningful improvement.
The capabilities of LTS Data Point help you understand what effective digital KPI analysis looks like.
For detailed over view, gain more insights from Top 10 features to look for in a modern KPI monitoring system
Examples of Key Performance Indicators
Below are practical KPI metrics examples grouped by department and business function.
Financial KPI examples

Financial KPI examples help businesses track profit, efficiency, and financial stability. Some examples of financial KPIs, along with a sample financial KPI tracking dashboard, are given below.
Examples:
- Revenue growth
- Gross profit margin
- Net profit margin
- Return on investment
- Cash conversion cycle
- Operating cost ratio
Sales KPI examples

Sales KPIs track pipeline quality, conversion, and revenue generation. Some examples of sales KPIs, along with a sample sales KPI tracking dashboard, are given below.
Examples:
- Sales growth
- Lead-to-customer conversion rate
- Customer acquisition cost
- Average deal size
- Sales cycle length
Marketing KPI examples

Marketing KPIs measure demand generation, campaign performance, and contribution to growth. Some examples of marketing KPIs, along with a sample marketing KPI tracking dashboard, are given below.
Examples:
- Cost per lead
- Conversion rate
- Marketing ROI
- Website lead volume
- Organic traffic growth
HR KPI examples

HR KPIs monitor recruitment, retention, and people development. Some examples of HR KPIs, along with a sample HR KPI tracking dashboard, are given below.
Examples:
- Employee turnover rate
- Time to hire
- Absenteeism rate
- Training completion rate
- Employee engagement score
Customer service KPI examples
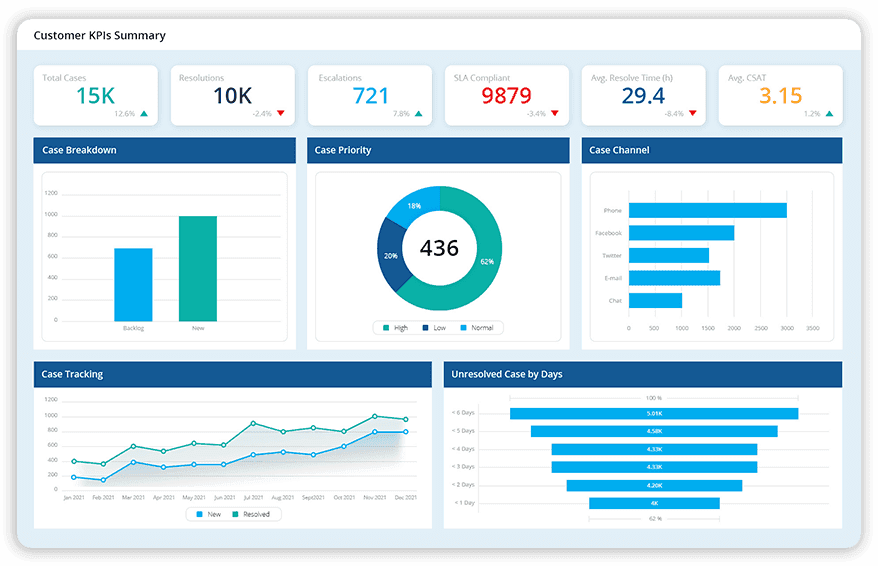
These KPIs track speed, quality, and satisfaction. Some examples of customer KPIs, along with a sample customer KPI tracking dashboard, are given below.
Examples:
- First response time
- Average resolution time
- Customer satisfaction score
- Complaint resolution rate
- Service level compliance
Retail & E-Commerce KPI
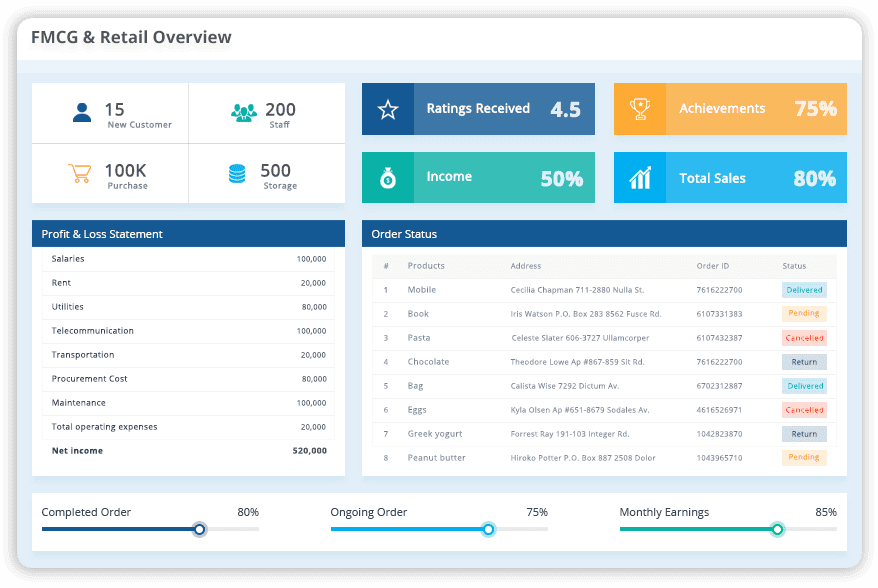
Measure the success of the business by understanding customer trends and changes. Some examples of Retail & E-Commerce KPIs, along with a sample Retail & E-Commerce KPI dashboard, are given below.
- Conversion Rate
- Average Order Value (AOV)
Project KPI examples
Project KPIs track delivery, cost, and schedule performance. Some examples of project KPIs, along with a sample project KPI tracking dashboard, are given below.
Examples:
- Schedule variance
- Cost variance
- Milestone achievement rate
- Resource utilisation
- Project ROI
Operations KPI examples
Operations teams focus on process efficiency, reliability, and delivery. Some examples of operations KPIs, along with a sample operations KPI tracking dashboard, are given below.
Examples:
- Cycle time
- Throughput
- On-time delivery
- Capacity utilisation
- Process adherence rate
KPI examples for managers
KPI examples for managers usually focus on team performance, execution, and accountability. Some examples of manager KPIs, along with a sample customer KPI tracking dashboard, are given below.
Examples:
- Team productivity
- Goal completion rate
- Budget adherence
- Employee retention
- Cross-functional issue closure rate
Managers often need a mix of strategic and operational KPIs, not just output metrics.
Explore KPI guides tailored for different managerial roles:
Top KPIs for Maintenance Manager
Employee KPI examples
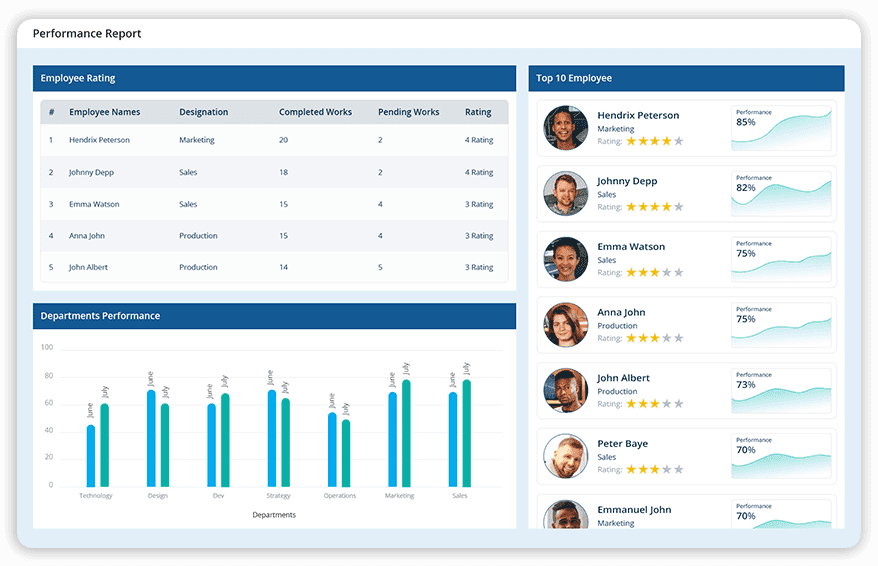
Employee KPIs are measurable values used to track an individual’s performance and contribution towards business goals. Some examples of employee KPIs, along with a sample employee performance tracking dashboard, are given below.
- Task completion rate
- Attendance and punctuality
- Quality of work (error rate)
- Productivity per employee
Corporate KPI examples
Corporate KPI examples are used to monitor overall business performance and strategic progress. Some examples of corporate KPIs, along with a sample corporate KPI tracking dashboard, are given below.
Examples:
- EBITDA
- Revenue growth
- Customer retention
- Strategic initiative completion
- Employee engagement
- Market expansion progress
- Market expansion progress
Government KPI examples
Government KPI examples often focus on service delivery, compliance, efficiency, and public value.
Examples:
- Case processing time
- Budget utilisation
- Citizen satisfaction
- Policy implementation rate
- Service response time
Industry-Specific KPIs
Different industries define performance differently. That is why Industry-Specific KPIs matter.
Manufacturing KPI examples

Manufacturing KPI examples often focus on output, quality, cost, and reliability.
Examples:
- Overall Equipment Effectiveness
- First Pass Yield
- Scrap rate
- On-time delivery
- Cycle time
- Capacity utilisation
Production KPI examples
Production KPI examples are used on the shop floor to track how well production is running.
Examples:
- Units produced per hour
- Downtime minutes
- Changeover time
- Schedule adherence
- Rework rate
- Throughput
Maintenance KPI examples
Maintenance KPI examples are used to improve equipment reliability and reduce unplanned stoppages.
Examples:
- Mean Time Between Failures
- Mean Time To Repair
- Preventive maintenance completion rate
- Maintenance backlog
- Breakdown frequency
- Equipment availability
Healthcare KPI examples

Healthcare KPIs focus on patient outcomes, process efficiency, and service quality. Some examples of corporate KPIs, along with a sample corporate KPI tracking dashboard, are given below.
Examples:
- Patient satisfaction score
- Average length of stay
- Readmission rate
- Appointment wait time
Banking KPI examples

Banking KPIs track financial performance, customer relationships, and operational control. Some examples of banking KPIs, along with a sample banking KPI tracking dashboard, are given below.
Examples:
- Net interest margin
- Loan-to-deposit ratio
- Cost-to-income ratio
- Customer retention rate
Retail and e-commerce KPI examples
Retail KPIs focus on conversion, spend, fulfilment, and customer behaviour.
Examples:
- Conversion rate
- Average order value
- Cart abandonment rate
- Customer repeat purchase rate
Aerospace and Defence KPIs
Aerospace KPIs track operational efficiency, quality standards, and project performance in complex and regulated environments. Some examples of Aerospace and Defence KPIs, along with a sample KPI tracking dashboard, are given below.
Examples:
On-time project delivery rate
First-pass yield
Defect rate
Maintenance turnaround time
Pharmaceutical KPI Examples
Pharmaceutical KPIs track production quality, regulatory compliance, and operational efficiency. Some examples of pharmaceutical KPIs, along with a sample KPI tracking dashboard, are given below.
Examples:
Batch success rate
Deviation rate
Regulatory compliance rate
Production cycle time
Other KPI Examples by Category
The list below groups additional examples into a simpler reference format.
KPI Examples in Manufacturing and Operations
Because many operational teams work in fast-moving environments, KPI design needs to be practical.
Real-world manufacturing and operations use cases
Example 1: Production performance
A plant tracks:
- units produced per hour
- schedule adherence
- downtime
- scrap rate
This gives supervisors visibility into output, flow, and quality at the same time.
Example 2: Maintenance performance
A maintenance team tracks:
- MTBF
- MTTR
- preventive maintenance completion
- backlog age
This helps reduce breakdowns and improve asset reliability.
Example 3: Daily management
An operations team tracks:
- attendance
- safety incidents
- quality defects
- delivery performance
- action closure rate
This supports fast review meetings and clearer accountability.
These examples are especially relevant for teams using dashboards, digital boards, and structured review routines in live environments. Are you confused about how to choose the best ft manufacturing KPI software and which to choose. Read Which Manufacturing KPI Tool Is Best for 2026? Full Comparison Inside
What are some industry-specific KPIs for manufacturing?
By tracking these key manufacturing KPIs, manufacturers can ensure they maintain high standards of efficiency, quality, and productivity, ultimately contributing to better operational performance and competitive advantage. Key Manufacturing KPIs that manufacturers should never ignore include:
- Overall Equipment Effectiveness (OEE)
- First Pass Yield (FPY):
- Cycle Time
- Production Downtime
- Scrap Rate
- On-Time Delivery (OTD)
- Inventory Turnover
- Capacity Utilisation
Read it in detail here: Top 10 manufacturing KPIs to measure Operational Excellence
How do you measure KPIs?
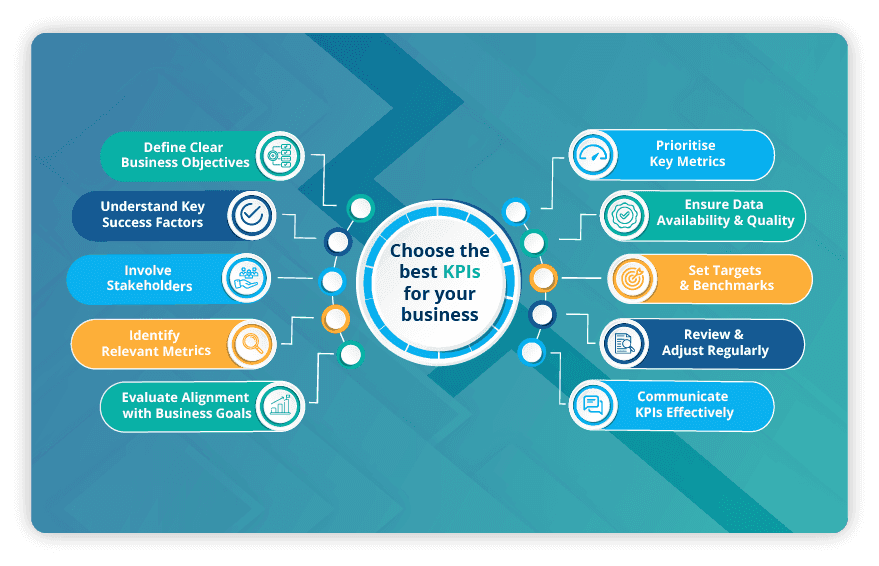
Measuring KPIs (Key Performance Indicators) involves a systematic approach to tracking and evaluating metrics that are critical to achieving organisational objectives. The Balanced Scorecard software solution plays a crucial role in this process by providing a comprehensive framework to measure KPIs across various facets of an organisation effectively.
By leveraging Balanced Scorecard software, organisations can efficiently measure KPIs, gain a holistic view of performance, and drive strategic initiatives that lead to sustainable growth and advantage in their respective industries. Measuring KPIs involves certain key steps, including:
- Define Clear Objectives: Define strategic objectives and goals aligning with the organisation's mission and vision.
- Select Relevant KPIs: Choose KPIs that directly reflect progress towards these objectives. Ensure they are Specific, Measurable, Achievable, Relevant, and Time-bound (SMART).
- Automate Data Collection: Balanced Scorecard software automates data collection from multiple sources, such as ERP systems, CRM platforms, and financial databases. This ensures real-time updates and reduces manual data entry errors.
- Visualise and Analyse Data: The Balanced Scorecard software enables the visualisation of KPIs through customisable dashboards, graphs, and scorecards. This visual representation helps identify trends, patterns, and performance outliers.
- Track Performance Against Targets: Monitor KPI performance against predefined targets and benchmarks. The software provides alerts and notifications when KPIs deviate from expected ranges, facilitating timely interventions.
- Generate Reports and Insights: Generate automated KPI reports summarising performance metrics, trends, and actionable insights. These reports support informed decision-making at all organisational levels. The Balanced scorecard software has built-in KPI report templates aimed at generating clear and concise performance reports of various strategic initiatives.
- Align KPIs with Strategy: Ensure that KPI metrics are aligned with organisational strategy and contribute to overall business success. Balanced Scorecard software helps cascade KPIs from strategic goals down to operational levels, ensuring alignment across departments.
- Continuous Improvement: Use the Balanced Scorecard software's data-driven insights to refine KPIs, improve processes, and optimise organisational performance.
What are SMART criteria for setting KPIs?
Setting KPIs using the SMART criteria involves the following steps. Organisations can set effective KPIs that drive performance and support strategic goals by following these SMART criteria—Specific, Measurable, Achievable, Relevant, and Time-bound.
➤ Specific
- Define Clear Objectives: Ensure each KPI is well-defined and specific to a particular goal or outcome.
- Example: Instead of "increase sales," specify "increase online sales by 15%."
➤ Measurable
- Quantify the KPI: Ensure the KPI can be measured accurately using reliable data.
- Example: Track the percentage increase in online sales revenue.
➤ Achievable
- Set Realistic Targets: Ensure the KPI is attainable and realistic given available resources and constraints.
- Example: Based on past performance and market conditions, setting a 15% increase is a feasible target.
➤ Relevant
- Align with Business Objectives: Ensure the KPI system is directly related to the strategic goals of your organisation.
- Example: Online sales growth should align with the broader goal of increasing overall market share.
➤ Time-bound
- Set a Deadline: Specify a clear timeframe for achieving the KPI.
Best Practices and Tips for KPI Tracking
Use these best practices to improve KPI quality and consistency.
1. Start with purpose
Do not define KPIs before defining goals.
2. Use a balanced set
Avoid relying only on financial or lagging indicators.
3. Keep the list focused
Too many KPIs reduce clarity.
4. Make ownership clear
Every KPI should have a responsible person or team.
5. Review on a fixed cadence
Daily, weekly, monthly, and quarterly reviews should each serve a different purpose.
6. Use clear visuals
A simple KPI chart is often more useful than a dense table.
7. Link performance to action
KPIs should trigger problem-solving, not just reporting.
8. Keep definitions consistent
Do not allow different teams to interpret the same KPI differently.
How can benchmarking help in setting KPI targets?
Benchmarking is crucial in setting KPI targets by providing organisations with external reference points and best practices from industry leaders or competitors. By comparing their performance metrics against benchmarks, businesses can confirm the areas of strength and weakness, understand industry standards, and set realistic yet ambitious KPI targets. Benchmarking helps establish performance improvement benchmarks, guide strategic decision-making, and align KPIs with achievable goals. This process ensures that KPI targets are meaningful, competitive, and aligned with industry standards, ultimately driving continuous improvement and enhancing organisational performance.
How can businesses effectively communicate KPIs across teams?
Businesses can effectively communicate KPIs across teams by following these communication strategies:
- Clear and Consistent Messaging: Use simple language to explain the purpose, relevance, and expected outcomes of each KPI. Ensure consistency in messaging across all levels of the organisation.
- Visual Representation: Utilise data visualisation tools such as charts, graphs, and dashboards to present KPIs in a clear and understandable format. Visual aids help teams grasp complex metrics quickly. A Balanced Scorecard is a visual interactive platform for keeping track of where your strategies are, your action plans and other improvements that are to be taken to improve your strategy.
- Align with Team Goals: Link KPIs directly to team objectives and demonstrate how achieving KPI targets contributes to overall organisational success. This creates a sense of ownership and alignment among team members.
- Regular Updates and Feedback: Provide regular updates on KPI performance and offer constructive feedback to teams. Encourage dialogue and discussion around KPIs to promote understanding and engagement.
- Training and Education: Conduct necessary training sessions to educate teams on the importance of KPIs, how they are measured, and their impact on business outcomes. Ensure all team members are equipped with the knowledge to interpret and act on KPI data effectively.
- Use of Technology: Leverage collaboration tools and platforms like a Balanced Scorecard to share real-time KPI data, encourage transparency, and facilitate continuous team communication
Summary
Key Performance Indicators (KPIs) are the foundation of effective performance management. They help organisations track progress, align teams, and make data-driven decisions across functions from financial KPIs and kpi metrics examples to manufacturing KPI, production KPI, and maintenance KPI.
But in today’s fast-moving, multi-site, and data-driven environments, traditional methods of KPI tracking are no longer sufficient. Manual spreadsheets, delayed reporting, and disconnected systems create gaps between performance visibility and real action.
To stay competitive, businesses need more than KPI definitions- they need a connected system that enables real-time tracking, structured kpi reporting, clear ownership, and continuous improvement.
KPI tracking software bridges this gap. It transforms KPIs from static metrics into a dynamic performance system, combining dashboards, scorecards, analysis, and action management in one place.
Data Point KPI tracking software brings this to life by integrating real-time KPI dashboards, SQCDP boards for manufacturing, FCIL Balanced Scorecards for service organisations, and built-in tools for root cause analysis, action planning, and performance reviews - ensuring that every KPI leads to measurable outcomes.
In a world where speed, alignment, and accountability define success, adopting KPI tracking software is essential.

Your questions, answered!
What are the benefits of using KPIs in a business?
How to track KPIs digitally?
How do KPIs support decision-making?
What makes a KPI effective?
How many KPIs should an organisation track?
Can KPIs be customised for different industries?
What is the role of KPI dashboards in performance management?
How do KPIs improve team alignment?
What are common mistakes when defining KPIs?
How do KPIs contribute to continuous improvement?
What tools are used to track KPIs effectively?
How do you ensure KPI data is accurate and reliable?
When should KPIs be updated or changed?
KPI Examples: The complete resource for tracking, analysing for achieving strategic goals
Get a Demo