Data Point Resource Hub
Everything you need to know about Balanced Scorecards and how to use them to drive strategic success and organisational performance.

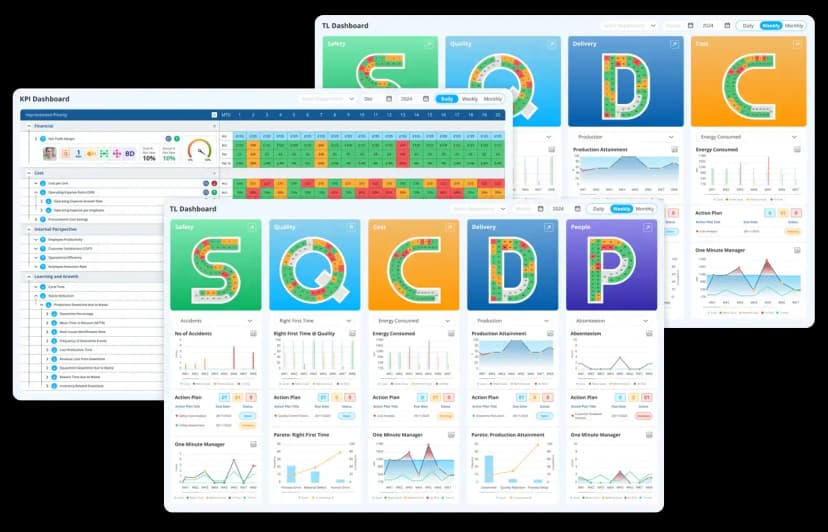
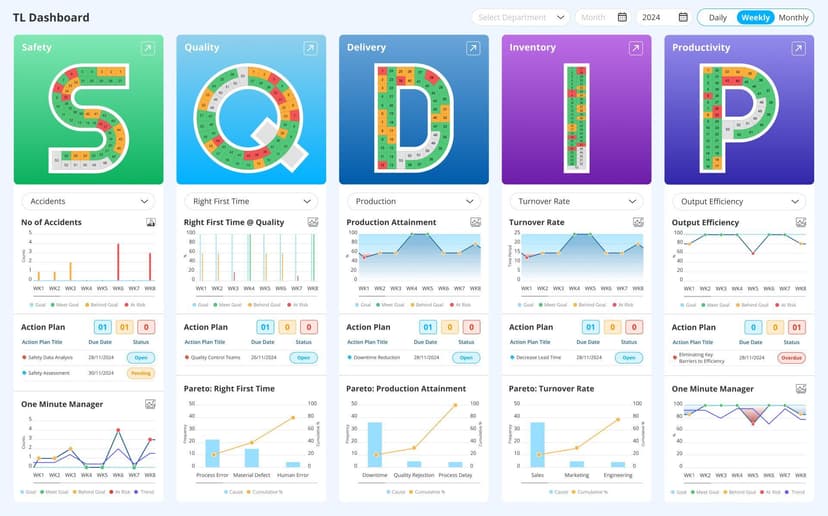
QCD Management: How Manufacturers Use Quality, Cost and Delivery to Drive Performance
QCD management integrates quality, cost, and delivery into a unified operational framework, helping manufacturers improve performance through QCD boards.
Continue ReadingResources
All
Balanced Scorecard
Lean Tools
Continuous Improvement Process
Key Performance Indicators
Gemba
Huddle Boards
Manufacturing Balanced Scorecards
Healthcare Balanced Scorecards
Banking Balanced Scorecards
DMAIC
OKR
Strategy and Alignment
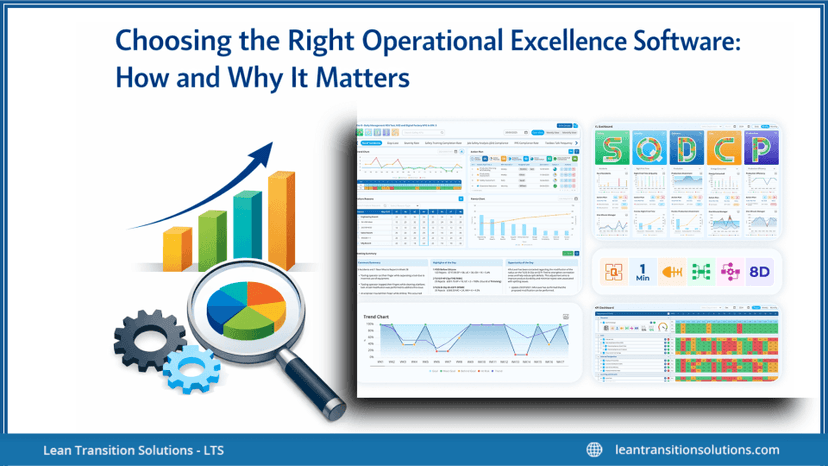
Operational Excellence
Lean Daily Management
Data Point vs Power BI
Hoshin Kanri X Matrix
Lean Visual Boards
Planning and Schedule


See how our Balanced Scorecard works for you !
Get a Demo